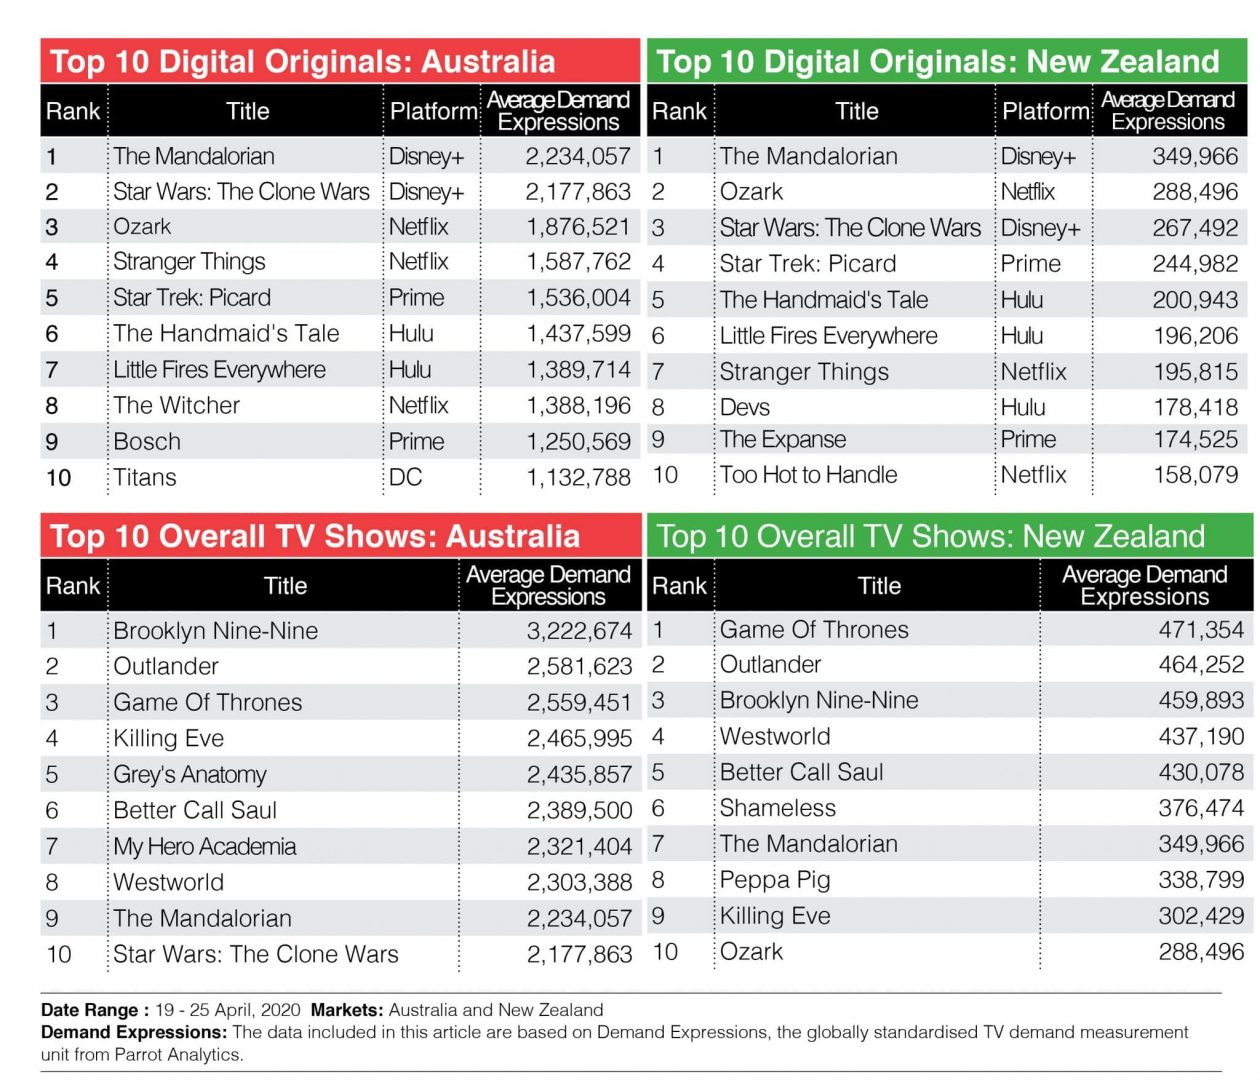
After initially spending 17 weeks atop the TV Demand charts The Mandalorian is once again the #1 digital original in both Australia and New Zealand. It is followed by Star Wars: The Clone Wars which gives the Star Wars franchise and Disney + the top two spots on the Digital Original chart.
Despite coming out in late 2019 The Mandalorian has produced 24.7 times the demand of the average TV series in Australia in the last 30 days. 2.7% of all shows in this market have this level of demand.
One of the most noticeable new entries this week is the Amazon Prime Video Original Bosch which has made its way into the top 10 of the Digital Originals chart in Australia. The American police procedural show released its sixth season on April 14, which was a day earlier than originally announced. The first season was influenced by the Michael Connelly novels City of Bones, Echo Park, and The Concrete Blonde.
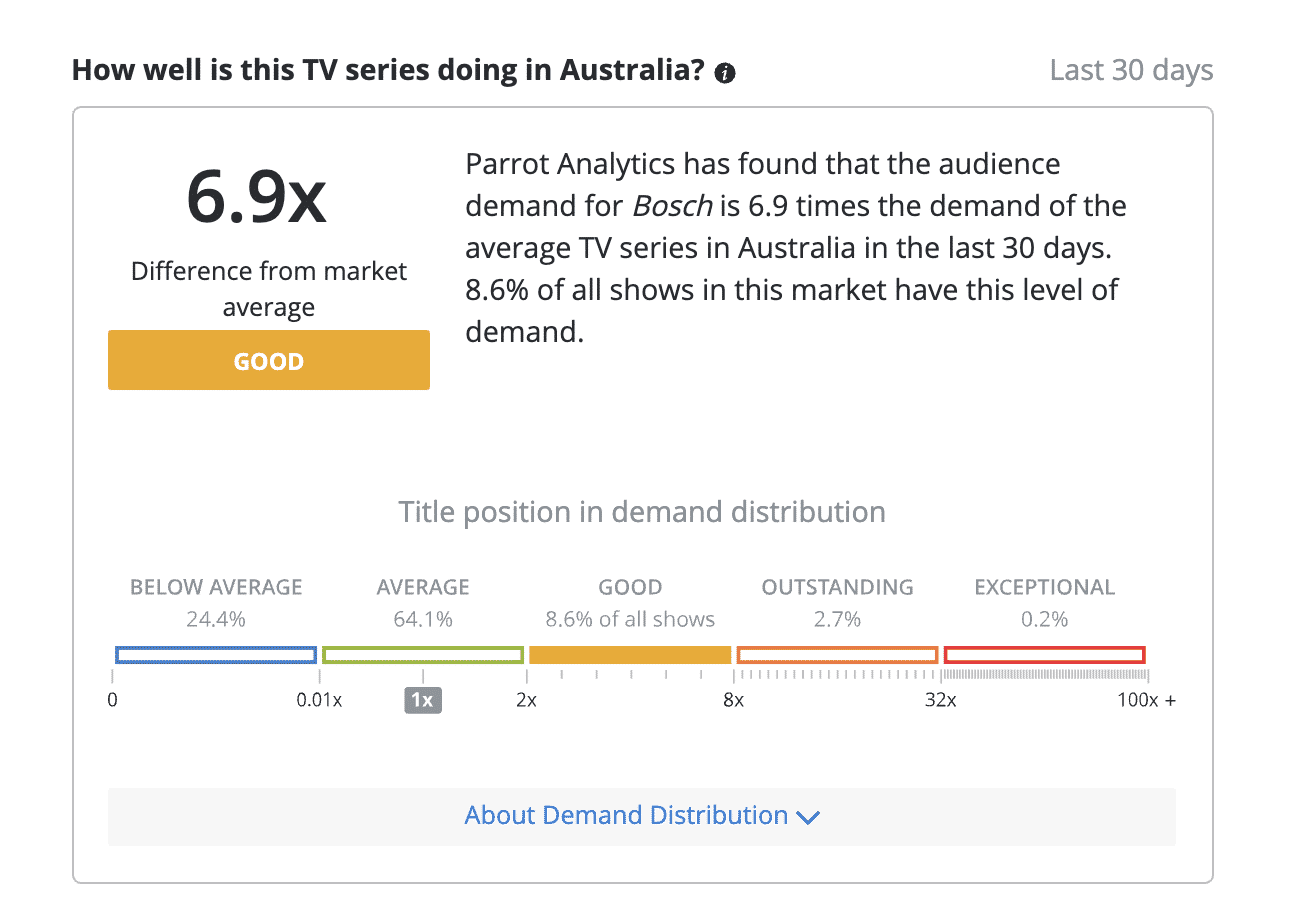
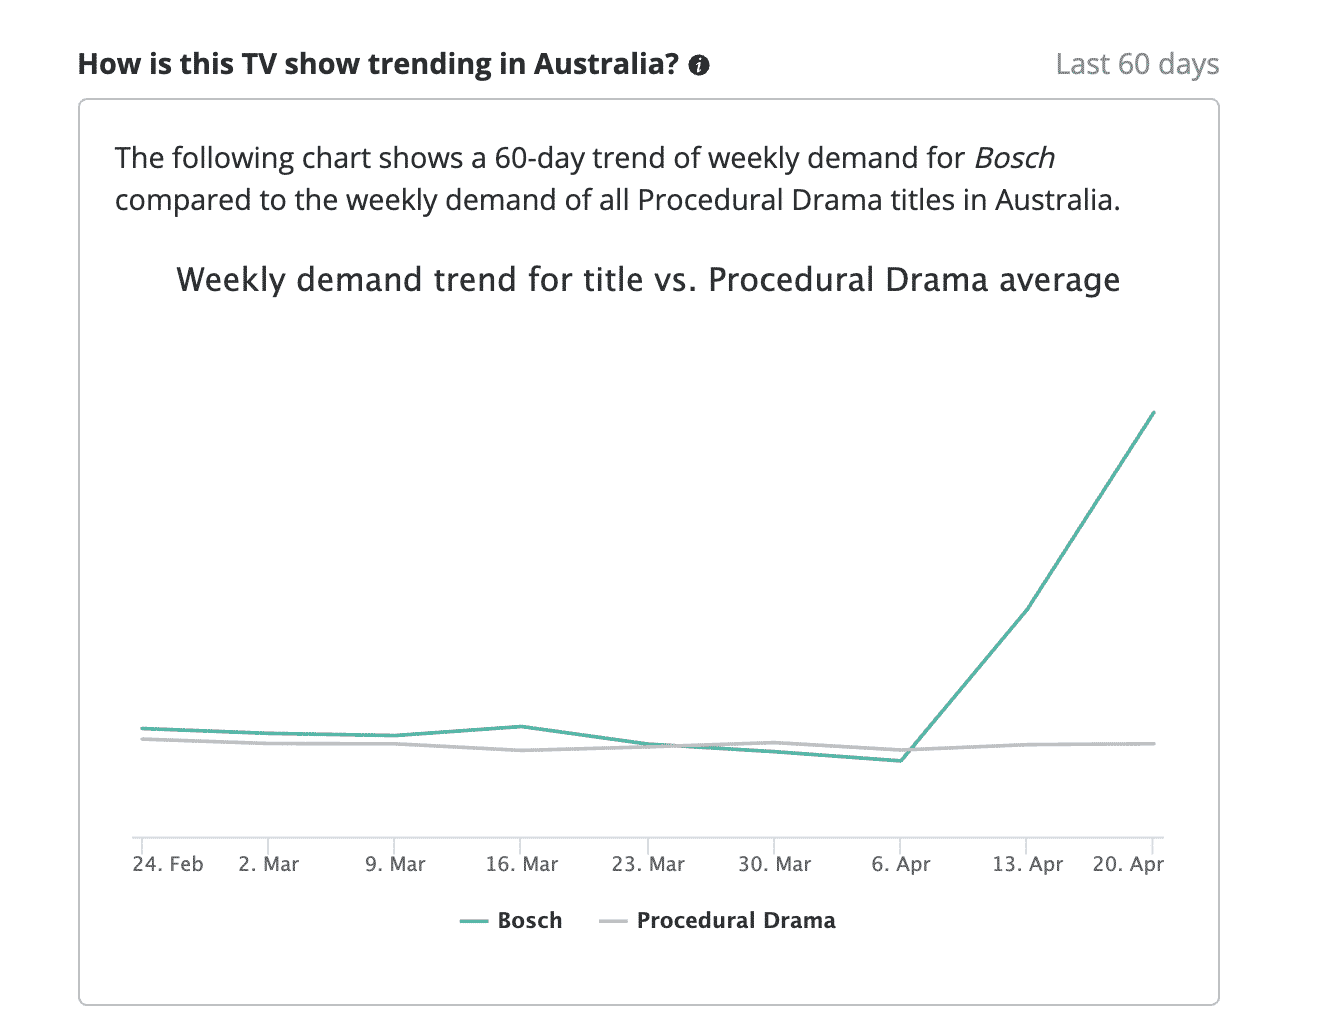
Over the last 30 days, Bosch has had 6.9 times the demand of the average TV series and the show had a huge surge on April 6 which has seen it find its way into the Digital Original top 10 in Australia for the 19 – 25 April 2020 period.
In NZ Too Hot to Handle entered the Digital Originals chart this week after being released on Netflix on April 17. The reality dating show assembled a group of young, single people and challenged them to create genuine connections instead of physical flings with the prize money decreasing if contestants engage in any sexual contact on the island with the money starting at $100,000.
The most popular piece of Australian content over the last 30 days was Married at First Sight with Parrot Analytics finding that the audience demand for Married At First Sight has been 11.6 times the demand of the average TV series in Australia in the last 30 days. 2.7% of all shows in this market have this level of demand this is despite the show declining by 50.7% over the last 30 days.
Parrot Analytics has now also made available an insights page for Australia and New Zealand which shows the company’s data on a rolling 30-day basis being updated daily. Note: Due to the 30-day rolling update these numbers will differ from the below weekly chart. You can look at Australia here and New Zealand here.