
BY DAN BARRETT
The 2015 Q3 Australian multi-screen report has been released this morning, revealing that TV broadcast viewership remains very high in Australian households despite a drop in the number of hours watched each month.
In this third quarter survey period, reporting July to September 2015, the average Australian watched 90 hours and 42 minutes of broadcast TV on in-home television sets each month. During the same reporting period in 2014 it was found that 96 hours and 58 minutes was spent watching broadcast TV. That year actually saw an increase in the number of hours watched, with 1 hour and 7 minutes of additional TV watched each month when compared to 2013. The diminished viewership of broadcast TV can likely be attributed to the successful launch of SVOD services in 2015, with Netflix and Stan launching earlier this year. A survey from Roy Morgan in November found that 2.677 million Australians now have access to Netflix.
Broadcast TV is defined in the report as including both free to air and subscription channels.
The drop in viewership was noted across all demographics, with teens recorded as having the greatest churn, watching 3.9% less in Q3 this year when compared to 2013.
Viewing playback TV on a TV in the home has dipped from 8 hours and 8 minutes to 7 hours and 45 minutes each month on average. Meanwhile, viewing playback TV on other screens has increased from 8 hours and 20 minutes a month to 8 hours and 31 minutes each month. This rise can be attributed to a number of reasons, with the most likely being an increase in the number of viewers streaming content from platforms like ABC’s iView. Many PVR’s nowadays also include the ability to stream recorded content over home wifi to users smart phones and tablets, bypassing the TV screen.
Watching TV on devices other than the TV screen in the home will be higher than just 8 hours and 31 minutes each month once you also factor in catch-up services Plus7, 9Jumpin, tenplay, and SBS On Demand. Because the content on catch-up services feature different advertising and have variations in the program that differ to what was broadcast, they are not included in the multi-screen report as playback TV.
In recent months, Australian TV broadcasters have indicated a strong interest in catching the increasing number of viewers watching TV on other screens. Seven recently rolled out its upgrade to its online service 7Plus, including the ability to live stream their linear broadcast channels, with Nine promising the launch of 9Now, a dedicated streaming platform that will offer catch-up and linear channel streaming that will replace the existing 9Jumpin service.
For other screen use, which will include the catch-up TV services, SVOD, AVOD, and other video platforms, the report cites an increase from 26 hours and 32 minutes on average each month to 28 hours and fifty minutes.
The report findings summary:
TV REACH REMAINS STRONG, AUSTRALIANS SPREAD VIEWING ACROSS SCREENS: Q3 2015 AUSTRALIAN MULTI-SCREEN REPORT
The latest Australian Multi-Screen Report – from Regional TAM, OzTAM and Nielsen, and covering the third quarter of calendar 2015 – continues its examination of changing viewing behaviour with the take-up of in-home technologies and new options to view television and other video content.
Australians remain heavy television consumers, and more choice in platforms and devices is seeing audiences spread their viewing across screens.
Trends identified in earlier editions of the report continue and include:
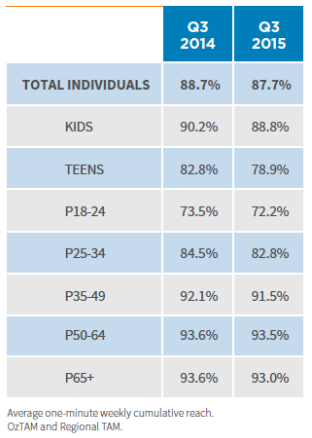
Most Australians watch broadcast television each week.
- Broadcast television viewed on in-home television sets reached 87.7 per cent of Australians in any single week of Q3 2015 (free-to-air and subscription channels).
- Broadcast television reach remains high among all major age groups.
For example, 72.2 per cent of people aged 18-24 – a relatively light television-viewing segment – watched broadcast TV on in-home sets each week in the latest quarter.
Most time spent viewing video content is on TV sets, and Australians are also using their sets for many other purposes.
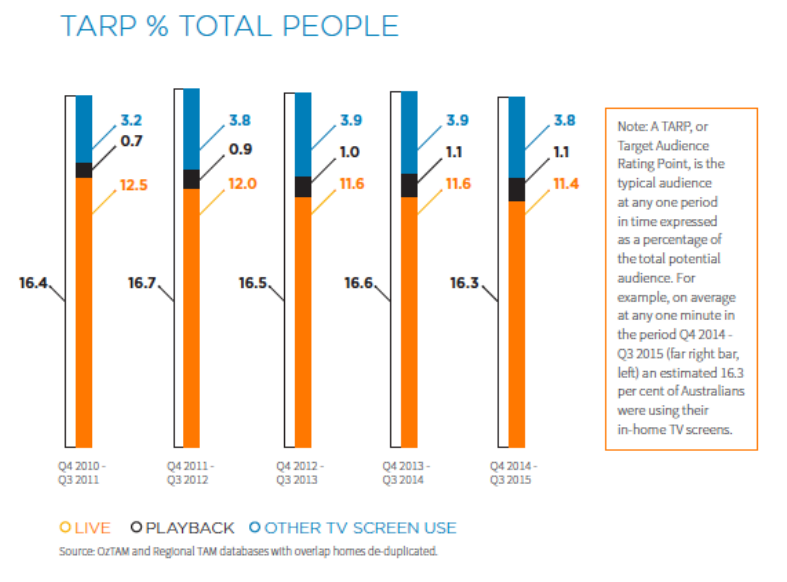
- Similar to recent quarters, on average 16.3 per cent of Australians were using their TV set for any purpose at any one minute of the day in Q3 2015.
- Though the proportion of time Australians spend watching linear broadcast TV has declined in the past five years, most television is still watched at the time of original broadcast:
- 91.5 per cent of all broadcast television viewed on in-home television sets in Q3 2015 was watched live.
- 8.5 per cent was played back through the TV set within seven days of original broadcast.
- Other TV screen use – when people use their television sets for purposes other than watching live or playing back broadcast television – has gradually risen over the past five years with take-up of technologies including internet-capable TVs; devices attached to the television such as PVRs/DVRs and games consoles; and over-the-top streaming video and other content services.In the rolling four quarters through Q3 2015 such other TV screen use eased slightly, down by 0.1 per cent TARP to 3.8 per cent TARP.However time spent on other TV screen use rose in Q3 2015, up 2 hours and 18 minutes (2:18) to an average 28:50 per Australian each month, compared to 26:32 in the same quarter a year earlier.
Australians are using connected devices to watch TV and other video content.
As seen in earlier editions of the Multi-Screen Report, the range of devices and platforms on which Australians can access broadcast and other video content gives people greater flexibility to view and therefore affects the time they spend using various devices.However broadcast television accounts for the majority of viewing time among all age groups:
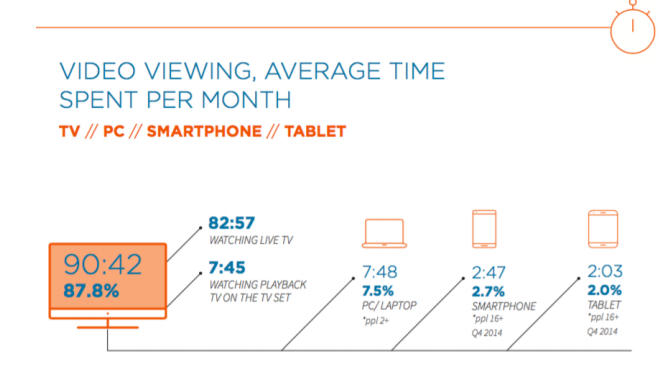
- 87.8 per cent of all video viewing – including broadcast and non-broadcast content – takes place on in-home TV sets.
- In Q3 2015 Australians on average watched 90 hours and 42 minutes (90:42) of broadcast television per month, down 6:16 per month year-on-year and reflecting the way Australians are spreading their viewing across multiple options.
- 12.2 per cent of viewing is on screens other than TV sets (12:38 per month).
This includes broadcast content – e.g. television network catch-up and streaming sites and apps – as well as non-broadcast video such as YouTube, Vimeo and Facebook.
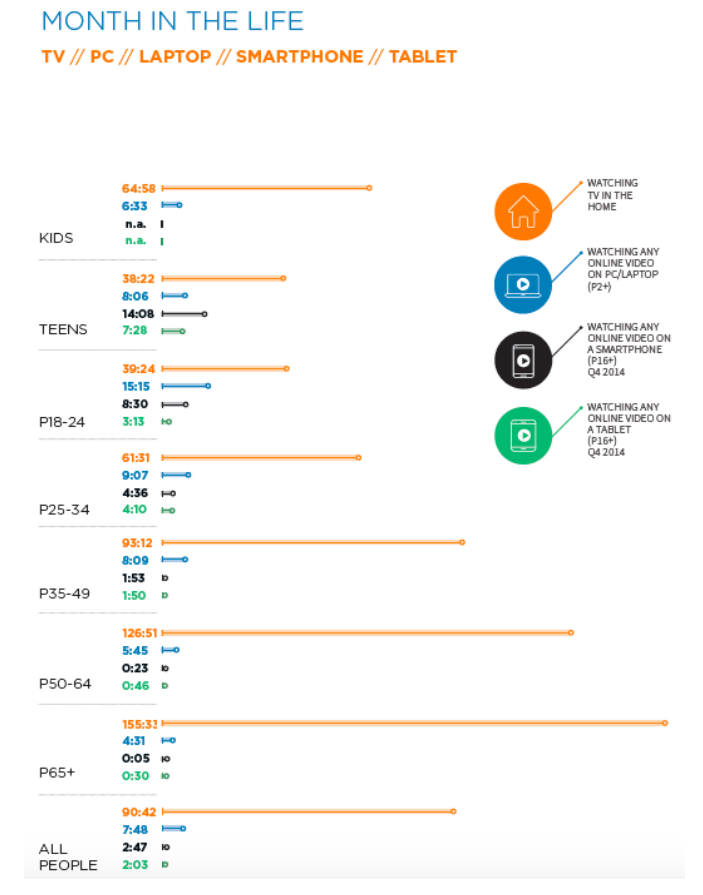
 Though younger Australians in particular increasingly use connected devices to watch any video content, people in all age groups spend the majority of their viewing time watching broadcast TV on in-home sets.
Craig Johnson, Head of Nielsen’s Reach Solutions, Southeast Asia, North Asia and Pacific said: “The TV set remains at the core of video consumption and we don’t see that changing any time soon. What is changing rapidly though is the expansion of screen time and screen types as Australians get comfortable with viewing video content on mobile devices, anytime, anywhere. There’s never been as much of a need for a complete view of the consumer’s media consumption as there is today.”
OzTAM CEO Doug Peiffer said: “More choice is leading Australians to spread their viewing across content and platform options. While this means they spend a little less time each month watching ‘traditional’ TV, broadcast television reach remains high: most Australians, younger and older alike, watch linear television each week.”
Regional TAM Chair and NBN Television CEO Deborah Wright said: “With the extensive range of platforms and devices Australians now have available to watch television program content, broadcast television still reaches 88 per cent of Australians each week. Whilst viewing is fragmenting across these platforms and devices, in regional markets specifically time spent watching broadcast television still delivered a solid 100 hours and 26 minutes as a monthly average.”
Summary of key findings: Q3 (JULY – SEPTEMBER) 2015:
- 22.175 million Australians watch broadcast television (free-to-air and subscription channels) each month, with average weekly reach at 87.7% of the population[1].
- Australians watch on average 90 hours and 42 minutes (90:42) of broadcast TV on in-home television sets per month (year-on-year down 6:16 per month, reflecting how Australians are spreading their viewing across a range of options).
- 91.5% of all broadcast TV viewing is live (82:57) with playback of broadcast content through the TV set within seven days of original broadcast comprising 8.5% (7:45 per month; 8:08 in Q3 2014).
- 100% of Australian television homes can access digital terrestrial television (DTT) channels.
- 97% can do so on every household TV set. 95% can receive high definition (HD) DTT broadcasts on every household TV set.
- 57% of homes have PVRs; 16% have two or more (Q3 2014: 55%; 15%).
- 31% of homes have internet-capable TVs, whether connected or not (Q3 2014: 29%).
- 49% of homes have tablets (45% in Q3 2014).
- 80% of Australians aged 14+ own a smartphone (76% in Q3 2014)[2].
- Household internet penetration is stable at 80%.
- Australians spend on average 34:44 per month online[3] (37:44 in Q3 2014).
- 13.352 million Australians watch some video on the internet each month (including broadcast TV and non-broadcast content): an average of 7:48 per month (up 18 minutes from 7:30/month a year ago). Such viewing is highest among people aged 18-24 (15:15 per month)[4].
- 87.8% of all video viewing[5] – across all screens, and including broadcast and non-broadcast content – takes place on in-home TV sets[6]:
- 90:42 per month on in-home TV sets (87.8%)
- 7:48 per month online via PCs/laptops (7.5%)
- 2:47 per month on smartphones (2.7%)[7]
- 2:03 per month on tablets (2%)[8]
Sources: Regional TAM, OzTAM, Nielsen.