• Steady and gradual decline in the amount of time spent watching live and time-shifted TV
The Q1 (January-March) 2017 Australian Video Viewing Report (formerly known as the Multi-Screen Report) – from Regional TAM, OzTAM and Nielsen – shows video viewing behaviour continues to shift with growing content, device and platform choices.
The report examines the times of day when Australians watch video as well as the amount of time they devote to doing so for a more complete perspective on changing viewing patterns.
For instance, at home – where most video viewing takes place – Australians have numerous options, and this encourages the cross-screen “spreading” behaviour observed for several years.
That in turn contributes to the steady and gradual decline in the amount of time Australians spend watching live and time-shifted TV – particularly in the evenings, when people generally have the most available time.
Meanwhile, now-ubiquitous connected mobile devices allow people to consume video at different times of day, including when they are outside the home. For some people this creates more time and opportunity to watch.
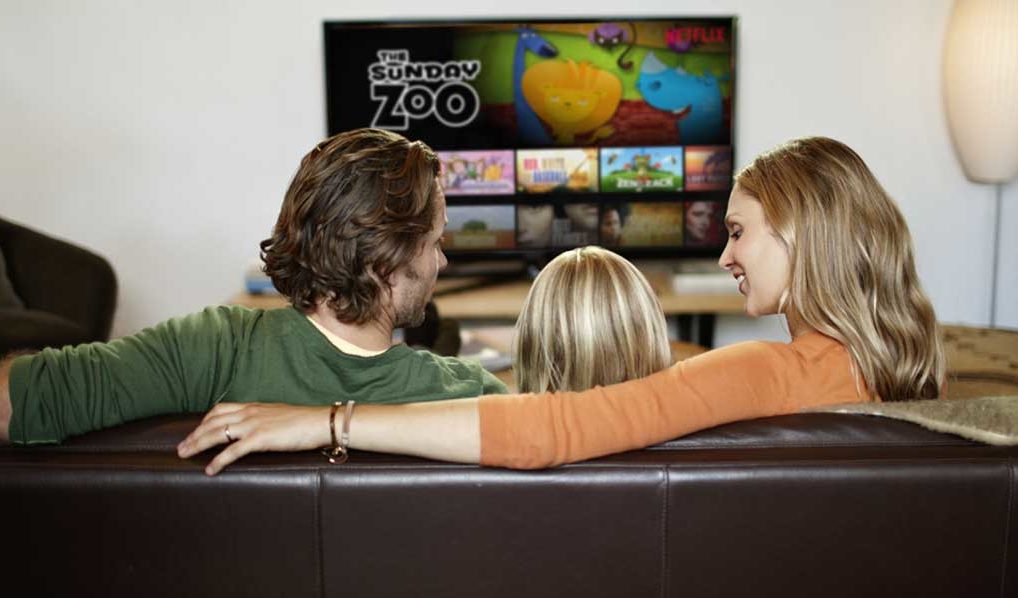
Despite unprecedented choice, on average across the total population TV remains the most-watched screen, and most Australians watch some broadcast TV (free-to-air and subscription channels) each week.
Broadcast TV viewing on tv sets [1]
• 19.9 million Australians (83.7% of the population in people metered markets) watch some broadcast TV (free-to-air and subscription channels) on in-home TV sets each week.
Reach is strong among all age groups. For example, across the day two-thirds (65.6%) of 18 to 24-year-olds – who are relatively light viewers compared to other age groups – watched broadcast TV weekly in Q1 2017.
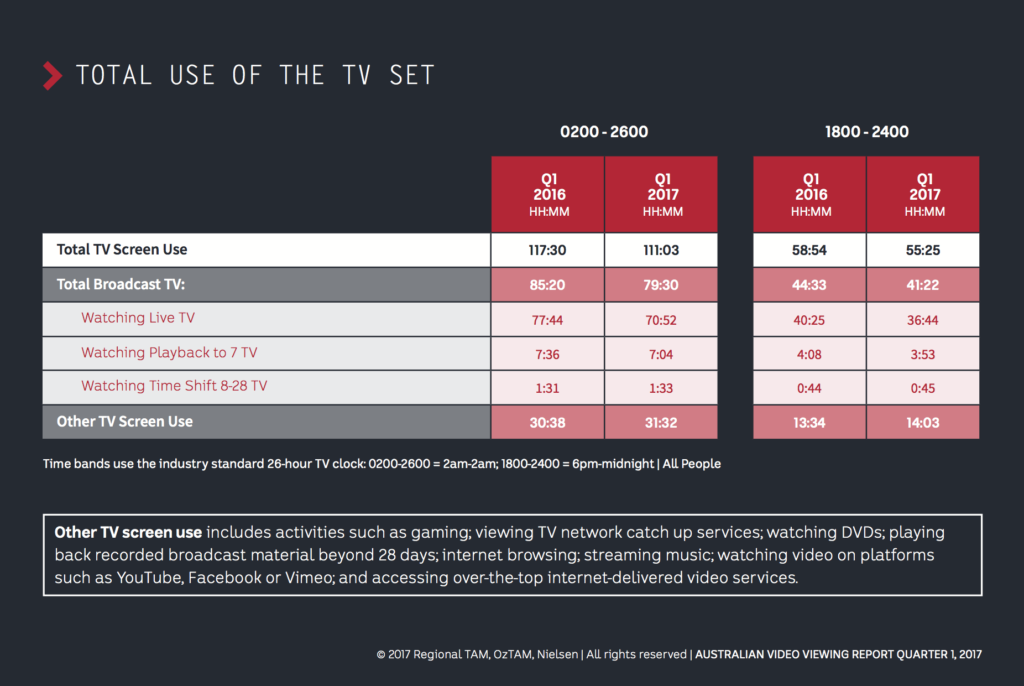
• In Q1 2017, Australians watched an average of 79 hours and 30 minutes (79:30) of broadcast TV on in-home TV sets per person each month:
* 89.1% (70:52) was watched live-to-air.
* 8.9% (7:04) was played back within seven days.
* 1.9% (1:33) was time-shifted between eight and 28 days of the original broadcast.
• As television sets become increasingly smart and multifunctional, Australians are devoting a greater percentage of the time they use them for purposes other than watching live or playing back broadcast TV:
* In Q1 2017, Australians spent 28% of their time with their TV sets across the day doing something other than watching live or playing back broadcast TV within 28 days. In primetime the proportion of this other TV screen use was 25%.
* Even with extensive platform, content and device choice, Australians watch 2:39 of live and playback TV on in-home TV sets each day – 33 fewer minutes per day than they did six years ago (Q1 2011).
Broadcast TV viewing on connected devices [2]
• Between 1% and 2% of all broadcast TV content viewed each week takes place on connected devices.
• Device portability and the times at which people are available to watch influence viewing patterns:
* All connected devices have an evening viewing peak.
* There is more online viewing during the daytime at weekends compared to weekdays.
* On weekdays catch-up (video on demand) viewing on tablets picks up in the afternoon, coinciding with the end of the school day.
* There is also a slight bump for catch-up viewing on weekdays around lunchtime.
* Catch-up activity peaks later in the evenings than live streaming.
* While live viewing on desktops and laptops builds through the day (as it does for other connected devices), live streaming on tablets and smartphones progressively builds to a peak later in the evening.
* There is a clear weekday morning peak on smartphones and tablets for both live and catch-up viewing.
* On weekend mornings catch-up on smartphones and tablets is more pronounced from early until midmorning.
Video viewing on desktops and laptops [3]
• Active online Australians aged 2+ who watch any video on a desktop or laptop spend on average 13:04 per month per viewer doing so.
Such viewing is highest among 18-24s (22:04) and lowest among people 65+ (6 hours).
Video viewing on smartphones and tablets [4]
• Online Australians aged 18+ who watch any video on a smartphone or tablet claim to spend 2:46 and 2:34, respectively, per person doing so each month.
18-24s say they watch the most video on smartphones (9:01 per month). 25-34s claim to watch the most on tablets (4:23).
OzTAM CEO Doug Peiffer said: “The Q1 2017 Australian Video Viewing Report confirms Australians’ huge appetite for video. As people embrace device and platform choice, for some these new options actually create more time to stay up to date with their favourite TV programs or watch other video – for example, while commuting or taking a few minutes out during their lunch break.
“Although connected screens and endless content options contribute to the gradual decline in the time people spend watching live and time-shifted TV, particularly for younger viewers, nearly all Australians watch broadcast TV each week. On average across the total population TV remains the most-watched screen.”
Additional findings: Q1 (Jan-Mar) 2017
• On average, Australian homes have 6.2 screens each (6.4 in Q1 2016).[6]
• 59% of homes have PVRs; 17% have two or more (Q1 2016: 58%; 17%).
• 38% of homes have internet-capable TVs, whether connected or not (Q1 2016: 35%).
Within those homes, 69% of internet-capable TVs are connected, equating to 26% across all TV households.
• 49% of homes have tablets (49% in Q1 2016).
• 81% of households have one or more smartphones (81% in Q1 2016).
• 100% of Australian television homes can access digital terrestrial television (DTT) channels.
• 97% can do so on every household TV set.
• 96% can receive high definition (HD) DTT broadcasts on all TV sets in the home.
• Household internet penetration is stable at 79%.
Sources: Regional TAM, OzTAM, Nielsen. The full report is available upon request.
About The Australian Video Viewing Report
[1] Time spent watching broadcast TV in the home is from combined OzTAM Metro and Regional TAM databases with overlap homes de-duplicated. Average time spent viewing 2am-2am (0200-2600) per person, whether or not they watch TV, within metered markets. Includes free-to-air and subscription television channels. Playback is ‘when watched’. Fractional minutes have been rounded.
[2] OzTAM Video Player Measurement (VPM). All participating broadcasters’ online content played to connected devices.
[3] Time spent watching any video on desktop/laptop is from Nielsen Online Ratings (NOR) – Hybrid Streaming. Per viewer (active users only) aged 2+.
[4] Time spent watching any video on a smartphone or tablet is from Nielsen Australian Connected Consumers Report 2017. Online Australians aged 18+ per person, regardless of video consumption.
[5] Combined OzTAM Metro and Regional TAM databases with overlap homes de-duplicated. Universe estimates: Total TV Q1 2017. Alternate Shopper defined as Main Grocery Buyer ‘no’ and Shopper ‘yes’.
[6] Estimates for internet connection, smartphone in home, tablet household penetration and internet capable TV in home are from combined OzTAM Metro and Regional TAM quarterly Establishment Surveys (ES). Based on mobile and landline CATI ES. Internet connection and tablet penetration based on rolling four-quarter averages to stabilise month-to-month trends. Estimate for internet-capable TV in home refers to the capability to be internet connected, whether connected or not. Smartphone estimates are percentage of homes with at least one smartphone.