
For the first time, advertisers have been able to get a snapshot of total video consumption – just what sort of video people are watching at home.
OzTAM has estimated the share of video viewing in Australian homes for the month of June 2021 (May 30 – June 26, 2021). The numbers show that advertisers who choose to go big with FTA TV are making the right choice.
The data represents OzTAM’s best estimate of total video usage in-home on any device, blending data collected from the standard TAM panel along with a national streaming meter panel. It is the first cross-platform view of audience behaviour ever available in Australia.
“We can now say with confidence this is what video advertising looks like in homes and this is what ad-supported video looks like in homes,” ThinkTV CEO Kim Portrate told Mediaweek.
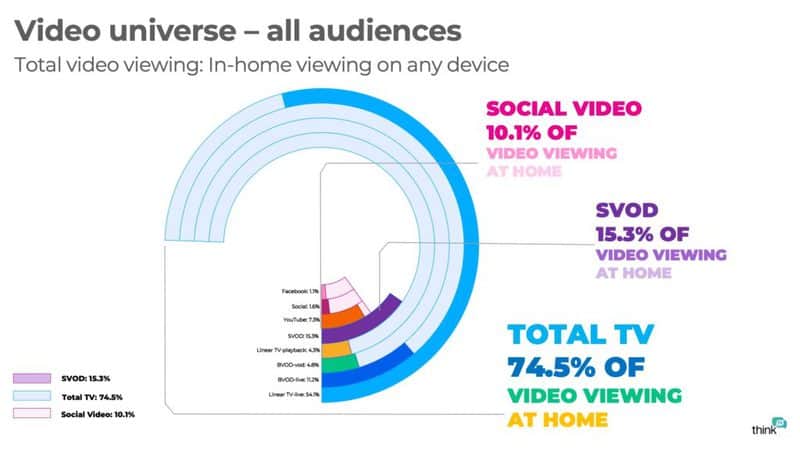
“We can split out the SVOD figures and work out how many are consuming SVOD. We quite often get anecdotal information, but we don’t always get hard measurement. About 15% of video consumed at home is through SVOD services – that includes platforms like Stan, Disney, Netflix and Amazon.
“Linear TV is about 75% and social video is about 10%.
“What we are now able to see is the split of YouTube and Facebook versus TV. We now have really useful data for people buying video who are figuring out where to invest.”
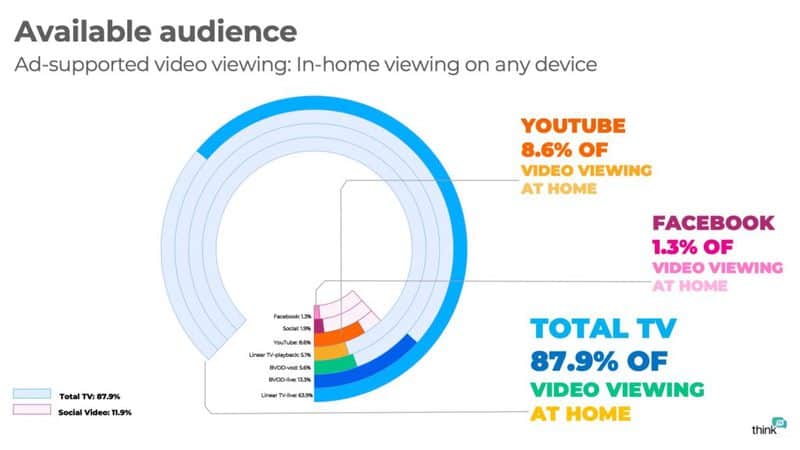
Portrate noted for advertisers it indicates Facebook, with estimated time spent viewing of just 1.3%, is less of a competitor in video than perhaps some might have thought. “That is aside from the issues of viewability and clutter. The Facebook video audience consumption is actually very small.
“YouTube is a bit more at 8.6% which is not surprising given the growth of connected TVs.
“The good news for us is that TV in home is still massive irrespective of device. TV remains the place to get fast, high-velocity reach – perfect for an advertiser who wants scale and wants it quickly.”
A key message for brands is what this means for the video market.
“If you are an advertiser don’t get confused about the articles you read about streaming platform’s activity,” said Portrate. “Even if you find out the actual number watching it is irrelevant because it’s a small percentage of the overall and it doesn’t carry any advertising.
“Australia’s video universe is vast with a range of viewing options. But for marketers, the choice is actually quite simple. The reason for this is the difference between the total video universe and available audience.”
The list of streaming video options available to audiences in Australia continues to grow – 10 Play to 9Now, 7plus, Kayo, Foxtel Go, Foxtel Now, Paramount+, Netflix, Stan, Amazon Prime, Binge, iview, Vimeo, YouTube, Tubi, Disney+, Apple TV+, SBS On Demand, Stan Sport and Tik Tok etc.
Portrate’s message to brands: “Advertisers should instead focus only on ad-supported video platforms – a much shorter list.
“Advertisers should note that the 15% of the audience watching SVOD in homes is not accessible to brands. Can I buy an ad in what is being watched is an important question. I mentioned clutter before. On TV when an ad is on it is full screen and doesn’t have any tickers or banners and there’s no chance of scrolling where you might miss some of it.”
One of the Covid-assisted trends has been the increasing growth of BVOD. “A lot of that growth has come from internet-connected TVs,” said Portrate.
“There has been a big increase in live streaming, according to data collected before Tokyo 2020. The growth in the BVOD viewing has come largely from females aged 25-54,” she added.
“The big attractions for that demo have been drama and reality TV. Kid’s TV crops up too because kids are watching on the mother’s device.”
About the OzTAM data:
• The data is not weighted at a metro or national level, but is a representation of the complete in-home video consumption landscape.
• The TV portion of the viewing includes co-viewers where they are registered in the OzTAM people meter system.
• Other devices are assumed to have only one viewer for any viewing session.
• This data represents in-home usage only and does not include extra viewing to BVOD, SVOD and social services from out-of-home venues.
• The data does not include any viewing to gaming, pornography or other non-broadcast video usage.
Download the new ThinkTV Fact Pack here.
See also: VOZ data reveals Total TV audience of 20m weekly