
Every Wednesday Mediaweek provides a weekly TV Demand column with data from data science company Parrot Analytics which measure the popularity of TV content around the world. But what goes into making these charts and how do you measure the popularity of TV shows on an international scale?
Read the TV Demand columns here.
To find out we spoke with Parrot Analytics CEO and co-founder Wared Seger. With offices in Auckland, Los Angeles, New York, London, Mexico City, Sao Paulo, and Singapore, Parrot has accelerated quickly as it has established the industry’s first cross-platform global demand measurement standard for TV content. With a background in neuroscience including a Bachelor degree in Biomedical Science in neurobiology and a Masters degree in Bioscience Enterprise, his most recent role before Parrot Analytics was at the University of Auckland’s start-up program Velocity, and its sister organisation Chiasma, where he served as CEO and chair. With this background, Seger has led the development of the Parrot Analytics technology,
“I figured out quite early that every human innovation that has impacted the world in some way is based on three key principles: Science, Technology and Entrepreneurship. This really helped me to establish my own future pathway.
“Seeing the increasing importance of data made me realise the potential that existed to harness it in a way that created real value for organisations, such as media companies who rely on audience data to measure their success.”
Parrot Analytics’ measurement of demand for television shows includes social media engagement, video streaming and peer-to-peer protocols, photo sharing, blogging, and research platforms. The crux of Parrot Analytics product and the centre of our TV Demand column is the global Demand Rank system that the company produces which Seger explains uses data points to create a meaningful demand metric,
“We capture many, many new data points each day (more than a billion) across the entire global consumer activity spectrum, including video consumption (streaming and downloads), social media engagement (hashtags, liking, sharing) and research actions (reading about shows, writing about shows, etc.). In terms of downloading, just one of our many data sources, we hold the patent for deriving media usage according to consumer’s global P2P activity.
“The more consumer effort required, the more importance is attached to each signal. Once all the signals are weighted and combined, the audience demand for each show almost anywhere in the world can be compared with that of any other show using our globally standardized Demand Expressions metric.
“Our Demand Rank system ensures that the important demand signals (e.g. watching or downloading a series) are weighted more heavily than others. We use factors such as time as a key arbitrator, enabling us to filter out the “noise”, which results in a demand metric that is more than a measure of ‘buzz’ (which the industry, as you know, has had access to via traditional social listening tools for many years now).”
Parrot Analytics data was also used in conjunction with the upcoming 2020 edition of Guinness World Records to determine several new TV categories in the upcoming edition, will be available globally September 5.
The next step is how does Parrot Analytics monetise this data and find clientele? With the television industry in a state of flux with content being produced by streaming companies such as Netflix, Amazon, Stan, and Hulu, Parrot Analytics has found a demand for their data from content creators, marketers, and media companies in an attempt to increase the popularity of their content across all platforms. According to Seger, it does this by applying the global TV demand data to the industry’s key practices,
“We exist to help our partners around the world capture more value by applying global TV demand data to the entertainment industry’s core workflows. Our data accelerates content sales and distribution, informs better acquisitions and programming decisions, facilitates cost-effective marketing, de-risks production, helps content strategy and recommendations, informs better merchandising deals, and more. Clients partner with us to help them in all of these areas, which directly impacts their productivity and profitability.”
While Parrots Analytics is a data-driven company it doesn’t just stop at spreadsheets and charts as it brought its data to the red carpet this year with the first Global TV Demand Awards which saw The Walking Dead being named the ‘Most In-Demand TV Show’ in the World.
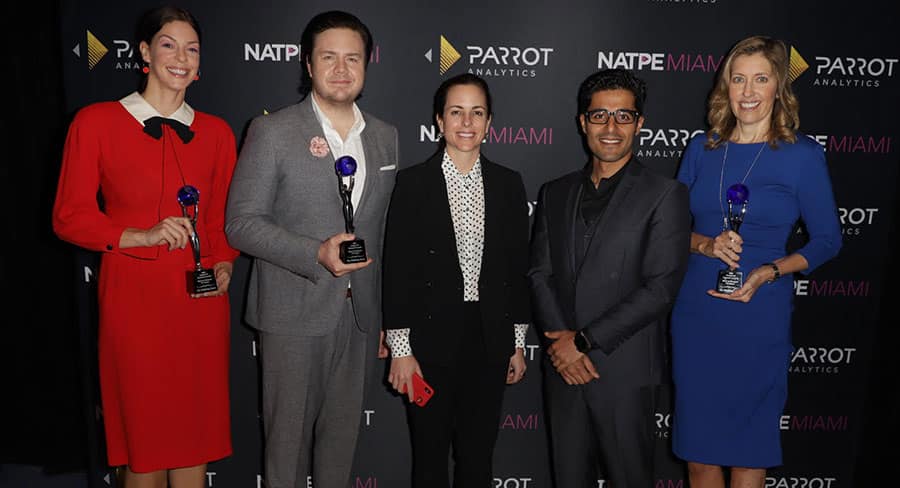
left to right: The Walking Dead’s Pollyanna McIntosh and Josh McDermitt; Parrot Analytics Board member Adriana Cisneros, CEO of CISNEROS; Parrot Analytics CEO Wared Seger; and Denise Huth, showrunner, The Walking Dead).
In January 2020, the Parrot Analytics Awards will return and will be adding several new categories, including regional awards. With Samuel Stadler, VP Marketing, Parrot Analytics announcing,
“As we know, there are a number of awards that honour the artistic merits of television shows and the creative talent behind them. At Parrot Analytics, we measure the audience demand for shows around the world, and we want to honor the shows that are resonating the most with viewers. The Global TV Demand Awards is the first data-driven awards show, and for 2020 we are adding more categories to showcase the impact of specific genres, as well as categories that illustrate the global influence of exports from territories with some of the top producers of content outside of the US. We’ll have more exciting details in the weeks ahead, so stay tuned.”