
The latest ThinkTV Fact Pack, covering the last half of calendar 2022, continues to track the changing viewing habits of consumers.
Advertisers who spent $4b+ in calendar 2022 know the numbers still tuning into commercial FTA TV.
The Total TV advertising market, which includes metropolitan free-to-air, regional free-to-air, subscription TV and Broadcaster Video on Demand (BVOD) and excludes SBS, recorded combined revenue of $4.1 billion for the year to December 2022, which was up 1.2 per cent compared to the same period ending December 2021.
See more: ThinkTV reports total TV advertising revenue is up for 2022
The data twice a year update from ThinkTV summarises the size and percentage of the audience numbers including how and when people watch.
ThinkTV chief executive Kim Portrate told Mediaweek the sort after audience summaries are to “make sure the information gets to the hands of the people who need it in a way that is easily accessible”. Download your copy here.
ThinkTV director of research Steve Weaver added, “It is pretty clear we continue to move rapidly through structural change.”
While acknowledging some of the data shows small POP and YOY declines, Weaver said: “The way people are viewing and consuming television remains quite solid.”
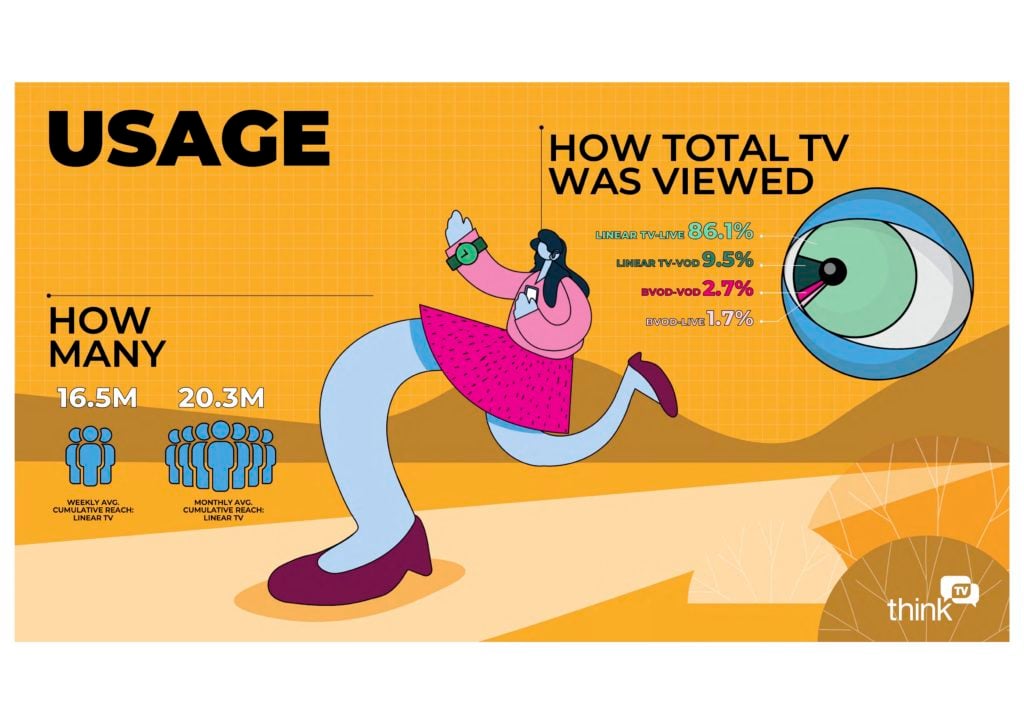
The monthly average cumulative linear TV reach remains above 20m. Movement year on year here is down from 20.78m to 20.3m.
The H2 2022 data begins with a summary of the percentage of total video viewing in the home on any device. This data shows the pull of the 11 major streaming platforms from market giants Netflix and Stan down to the niche players like Hayu and Acorn.
This tells us that those 11 streamers had a share of 15.3% of the time spent viewing across the period of this survey. That is up from 13.8% for the same six months in 2021.
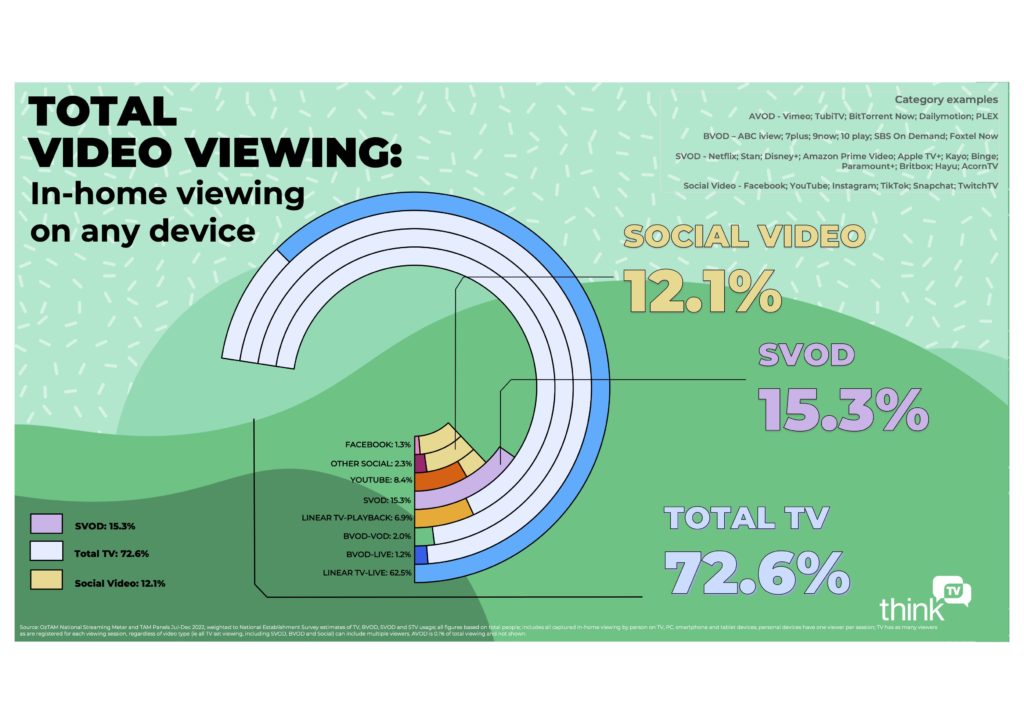
The Total TV figures which capture FTA live and on demand including Foxtel (except Binge and Kayo which are listed under SVOD) has 72.6% of viewing, down from 77.4% in 2021.
When you then look at Total Ad-Supported Video Viewing, the Total TV figure climbs to 85.7% (down from 89.8% in 2021).
The players lumped into the Social Video share of 14.3% include YouTube (9.9%) and Facebook (1.6%).
The average number of screens per household has remained steady at just under seven.
Despite the growing number of people watching all their TV through the FTA apps, live linear viewing continues to dominate with an 86.1% share of Total TV. Linear TV VOD has climbed to 9.5%.
Live TV viewing hours
The average monthly hours consumed per person was down across 2022. The first six months of the year the number was 55:41 yet it slipped to 51:14 in the second half of the year. Those 51 hours were split into 45 viewing live and less than six watching playback.
The weekly average cume reach of Linear TV was down ever-so-slightly across the year from 16.8m to 16.5m.
The monthly cume reach was steady though close to 20.5m.
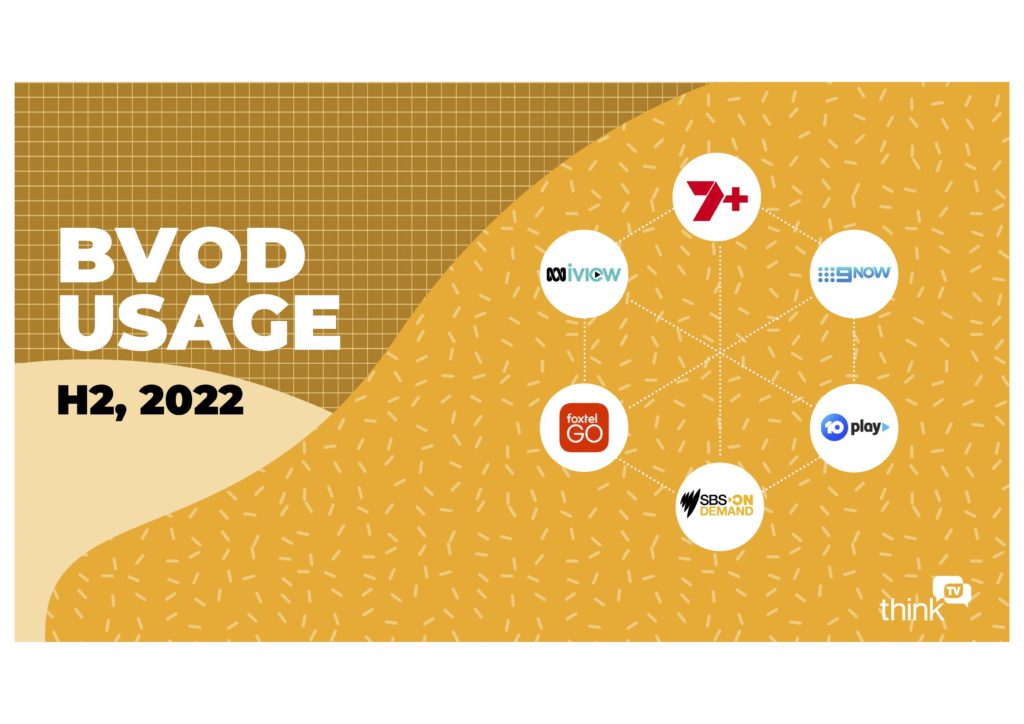
BVOD viewing
Three-quarters of all BVOD viewing is via a connected TV, with PC/Laptop (9.5%), mobile (8.5%) and tablet (7.5%) accounting for the rest.
The biggest consumers of BVOD viewing are women 40-54 (14.8%) and women 25-39 (14.1%). Men in both those demos come next.
The share of under 55 viewing is greater for BVOD as compared to Linear TV. That is, under 55s made up 72% of all BVOD viewing, while they made up 39.6% of all Linear TV viewing.
When looking at genre watched on BVOD, drama leads the way with 22.8%, while the most significant percentage drop across the year was reality TV (13.8% down to 11.9%) while the biggest increase was sport (12.3% up to 14.6%). ThinkTV’s Weaver pointed out the attraction of football finals and World Cup viewing in the second half of 2022.
The most-watched VOD program and most-watched episodes from each of the commercial players were:
Love Island (Nine) 411,000
Hunted (10) 258,000
Farmer Wants a Wife (Seven) 228,000
House of the Dragon (Foxtel) 288,000
The Handmaid’s Tale (SBS) 733,000
Weaver reminded Mediaweek these were BVOD-only numbers so when you add the Live TV numbers some of them push over 1m viewers. “To talk about how a show performs only on linear is disingenuous regarding the strength of that show and what it can do for the advertiser.”
Who watches more where?
The data splits up the viewing habits by the three major ratings panels and tracks how much they watch.
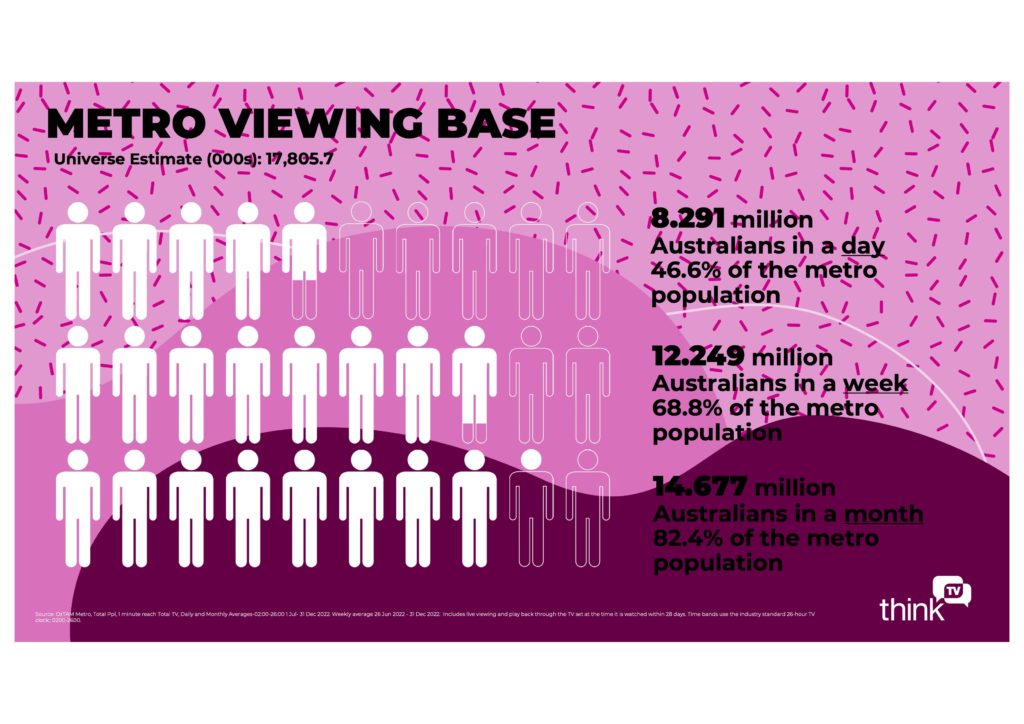
Metro daily viewing base of 8,291,000, people watch 1.35 hours
Regional daily viewing base of 4,008,000, people watch 1.59 hours
Subscription daily viewing base of 3,613,000, people watch 2.27 hours
See also: ThinkTV Fact Pack H1 2022: – Latest Total TV report tracks growth of BVOD – live & on demand