The latest Australian Multi-Screen Report – from Regional TAM, OzTAM and Nielsen, and covering the fourth quarter of calendar 2015 – shows that growing choice in video content and means of accessing it encourage consumers to spread their viewing across devices and platforms.
While Australians increasingly use connected devices to watch television and other video content, approximately 85 per cent of all video viewing takes place on in-home TV sets.
Ongoing trends
• Broadcast television reach remains strong.
87.4 per cent of Australians watched broadcast television (free-to-air and subscription channels) on in-home TV sets each week, on average, in Q4 2015. This compares to 88.5 per cent in the same quarter of 2014.
• Device and platform choice greatly expand the opportunities Australians have to watch TV and other video content, and influence time spent with various devices.
15.5 per cent of the time Australians spend viewing any video – including broadcast and non-broadcast content – is on computers, tablets or smartphones: an average 15 hours 42 minutes (15:42) per month – up from 12:18 in Q4 2014. This includes broadcast content – e.g. television network catch-up and streaming sites and apps – as well as non-broadcast video such as YouTube, Vimeo and Facebook.
In Q4 2015 Australians on average watched 85:17 of broadcast television on in-home TV sets each month, down 5:10 per month year-on-year and reflecting the way Australians are spreading their viewing across multiple options.
91.4 per cent, or 77:57, of broadcast TV viewed on TV sets in the quarter was live to air while broadcast TV playback through the TV set within seven days was 7:20.
Across all screens and all types of video content – broadcast and non-broadcast – 84.5 per cent of viewing is on TV sets.
Australians use their TV sets for an increasing variety of activities.
On average 16.4 per cent of Australians were using their TV set for any purpose at any one minute of the day in the rolling four quarters to Q4 2015 – steady on the same four quarters a year earlier.
Though the proportion of time Australians spend watching linear broadcast TV has declined in the past five years, most television is still watched at the time of original broadcast (live): 11.2 per cent TARP in the latest four quarter period. Playback of broadcast material through the TV set rose 0.2 per cent TARP year-on-year to 1.3 per cent TARP.
Other TV screen use – when people use their television sets for purposes other than watching live or playing back broadcast television – has gradually risen over the past five years.
This follows take-up of internet-capable televisions and devices attached to the TV set which enable a variety of activities, for example: viewing TV network streaming and video player services; watching DVDs; playing back recorded broadcast material beyond the seven-day Consolidated ratings window; internet browsing; streaming music; and accessing over-the-top internet-delivered services.
In Q4 2015, Australians spent an average of 28 hours and 43 minutes (28:43) per month on other TV screen use, up from 27:09 a year earlier.
New insights: Broadcast TV content played on connected devices
Since its debut four years ago the Australian Multi-Screen Report has examined people’s evolving viewing behaviour as their options grew beyond linear broadcast schedules and the TV screen itself.
The media industry has accordingly sought to understand how much TV content is played on connected devices.
In response, OzTAM has introduced its new Video Player Measurement Report, which provides Australia’s first official measure of viewing of internet-delivered TV content on devices such as tablets, smartphones, smart TVs, desktop and laptop computers, and games consoles.
According to VPM data, Australians played, on average, 112 million minutes per week of participating broadcasters’ internet-delivered TV content in Q4 2015.
This means VPM content represents about 1 per cent of all broadcast TV viewing in the period, though certain online program content can see relatively higher audience increases – similar to the way some broadcast programs attract a sizeable proportion of their total audience from playback (time-shifted) viewing.
VPM Report data will feature in the quarterly Multi-Screen Report from now on.
Deborah Wright, Chair of Regional TAM and Nine Entertainment Co Director of Regional Strategy, said: “The Australian Multi-Screen report continues to provide a holistic national overview of consumers’ viewing habits across platforms and devices. In a market where consumers have an ever growing list of options to view video content, the in-home TV set remains the predominate screen of choice. Our Regional TAM audiences in particular are spending almost 95 hours a month on average watching television, which is almost 9.5 hours more than the national average.”
OzTAM CEO Doug Peiffer said: “Connected devices are the new PVRs. As penetration rates for conventional personal video recorders level off, the number of PVRs actually in the market has grown dramatically: people now use their desktops, laptops, tablets and smartphones to watch catch up TV – just as they’ve grown used to time-shifting their broadcast viewing. Today, access to content means anywhere, any time, any connected device. OzTAM’s new VPM Report tracks this emerging behaviour, revealing how the audience to a piece of content travels across all platforms.”
Understanding the sources: a note about methodologies
The Australian Multi-Screen Report brings together data from:
• OzTAM and Regional TAM’s television audience measurement (TAM) panels, to estimate the time Australians across age groups spend viewing broadcast television (FTA and STV channels) on in-home TV sets each month. People meters in panel homes capture all viewing by all people in the home on every household TV set. These 5,600 panel homes include more than 13,000 people and collectively represent the characteristics of the overall population.
• OzTAM’s VPM service is census, rather than panel, based. This means whenever a person plays content on a connected device using a participating broadcaster’s video player, OzTAM captures it – whatever those devices are and wherever they are located.
• Nielsen’s national Hybrid Streaming data, from which ‘watching video on the internet’ figures are derived, is sourced from the Nielsen Online Ratings panel. Online video is measured using both tagged and metered panel based data from home and work panels. This hybrid methodology enables the extrapolation of total market metrics.
• Nielsen’s Australian Connected Consumers Report surveys a national representative sample of approximately 5,000 online Australians aged 16+ to quantify how they behave online, and place their online behaviours in context against other media use, including broadcast and non-broadcast video. ACCR figures are self-reported.
SUMMARY OF KEY FINDINGS: Q4 (OCTOBER – DECEMBER) 2015:
• 22.154 million Australians watch broadcast television (free-to-air and subscription channels) each month, with average weekly reach at 87.4% of the population[1].
• Australians watch on average 85 hours and 17 minutes (85:17) of broadcast TV on in-home television sets per month – year-on-year down 5:10 per month, reflecting new options that allow Australians to spread their viewing across a range of screens.
• 91.4% of all broadcast TV viewing is live (77:57). Playback of broadcast content through the TV set within seven days comprises 8.6% (7:20 per month; 7:21 in Q4 2014).
• Approximately 99% of all broadcast TV material viewed each month happens on in-home TV sets.[2]
• 100% of Australian television homes can access digital terrestrial television (DTT) channels. 97% can do so on every household TV set. 95% can receive high definition (HD) DTT broadcasts on every household TV set.
Consumer technologies that a few years ago were novel are now commonplace, with household penetration rates slowing accordingly. Also, some households will upgrade to a newer model of device and retain the older one for secondary use.
• 58% of homes have PVRs; 17% have two or more (Q4 2014: 56%; 15%).
• 32% of homes have internet-capable TVs, whether connected or not (Q4 2014: 30%).
• 49% of homes have tablets (47% in Q4 2014).
• 80% of Australians aged 14+ own a smartphone (76% in Q4 2014)[3].
Household internet penetration is stable at 80%.
• Australians spend on average 31:12 per month online[4] (37:08 in Q4 2014).
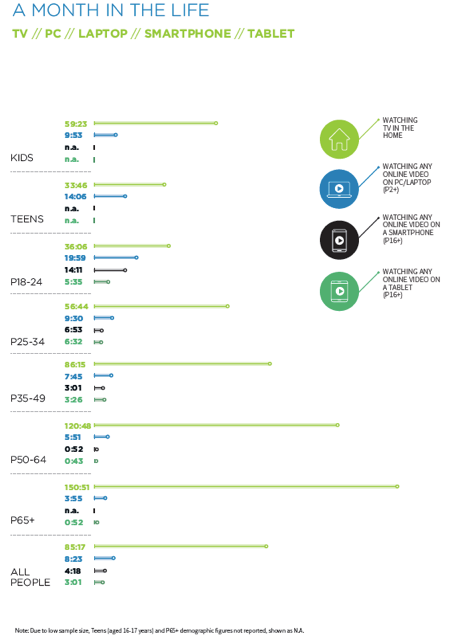
• 13.017 million Australians watch some video on the internet each month (incl broadcast TV and non-broadcast content): on average 8:23 per month, up 55 minutes from 7:28/month a year ago. Such viewing is highest among 18-24s (19.59 per month)[5].
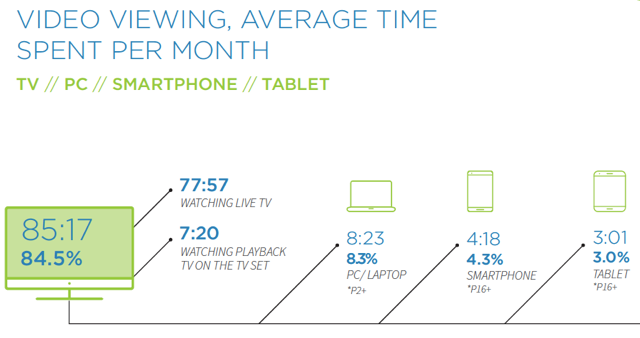
84.5% of all video viewing[6] – across all screens, and including broadcast and non-broadcast content – takes place on in-home TV sets[7]: Pls note the percentages below have been rounded.
• 85:17 per month on in-home TV sets (84.5%)
• 8:23 per month online via PCs/laptops (8.3%)
• 4:18 per month on smartphones (4.3%)[8]
• 3:01 per month on tablets (3%)[9]
Sources: Regional TAM, OzTAM, Nielsen.
About The Australian Multi-Screen Report
The Australian Multi-Screen Report, released quarterly, is the first and only national research into trends in video viewing in Australian homes across television, computers and mobile devices. It combines data from the three best available research sources: the OzTAM and Regional TAM television ratings panels; Nielsen Online Ratings and Nielsen’s Australian Connected Consumers report; and OzTAM’s Video Player Measurement (VPM) Report.
About Regional TAM
Regional TAM Pty Limited is a joint venture comprising the five free-to-air (FTA) regional commercial networks – NBN Limited, Prime Television Pty Ltd, Seven Queensland, Southern Cross Austereo, and WIN Corporation Pty Ltd. Collected and marketed by Nielsen Television Audience Measurement, Regional TAM data is the official television audience measurement (TAM) of FTA and Subscription Television viewing in the five east coast aggregated regional markets, including its 19 component sub-markets, and the Regional Western Australian market. Regional TAM television ratings information is designed to be an independent, reliable and transparent audience measurement system that provides the currency by which television is bought, sold and evaluated. The audience data is used by a range of parties such as television networks, advertisers, media buyers and program suppliers to aid them to understand viewer behaviour, and in assessing program or network performance.
More at http://www.regionaltam.com.au
About OzTAM
OzTAM is Australia’s official source of television audience measurement (TAM) covering the five metropolitan markets (Sydney, Melbourne, Brisbane, Adelaide and Perth) and nationally for subscription television. OzTAM ratings are the accepted metric by which Australian television is evaluated. The media industry uses OzTAM data to assist in program development, advertising planning and to gauge the performance of television programs, networks and advertising campaigns. OzTAM’s Video Player Measurement (VPM) reporting service provides Australia’s first official figures for viewing of internet-delivered TV content.
More at: www.oztam.com.au
About Nielsen
Nielsen N.V. is a global performance management company that provides a comprehensive understanding of what consumers Watch and Buy. Nielsen’s Watch segment provides media and advertising clients with Total Audience measurement services across all devices where content — video, audio and text — is consumed. The Buy segment offers consumer packaged goods manufacturers and retailers the industry’s only global view of retail performance measurement. By integrating information from its Watch and Buy segments and other data sources, Nielsen provides its clients with both world-class measurement as well as analytics that help improve performance. Nielsen, an S&P 500 company, has operations in over 100 countries that cover more than 90 per cent of the world’s population.
For more information, visit www.nielsen.com
—
Footnotes:
[1] OzTAM and Regional TAM. All people figures, 2am-2am.
[2] OzTAM and Regional TAM. All people figures, 2am-2am; OzTAM VPM data, Q4 2015.
[3] Nielsen Online Ratings Establishment Survey, national population 14+, Q3 2014-Q3 2015.
[4] Nielsen Online Ratings. Ppl 2+.
[5] Nielsen Online Ratings – Hybrid Streaming (formerly VideoCensus) ppl 2+. Please note March 2014 constituted a trend break for all key audience metrics from Nielsen Online Ratings – Hybrid, with the removal of ‘inactive’ panellists.
[6] Time spent viewing via the conventional TV includes broadcast content only; video viewing on PC, tablets and smartphones (‘other devices’) can include both broadcast and non-broadcast content.
[7] TV viewing: OzTAM/Regional TAM, all people, Q4 2015, 2am-2am. Smartphones/tablets: ppl 16+, self- reported, Q4 2015. Internet: ppl 2+, Q4 2015, Nielsen Online Ratings. Percentages have been rounded.
[8] Nielsen Australian Connected Consumers report 2016.