
Australians have an average of 6.4 screen per home, majority of which are internet-capable, show the latest Australian Multi-Screen Report covering Q1 of 2016. More than 86% of Australian are watching broadcast TV (FTA and subscription channels) on a in-home TV sets. This is down by 2% compared to Q1 in 2015. About 75% of claim to engaged with more than one screen simultaneously, this is most popular among younger consumers.
The Multi-Screen Report is produced by Regional TAM, OzTAM and Nielsen.
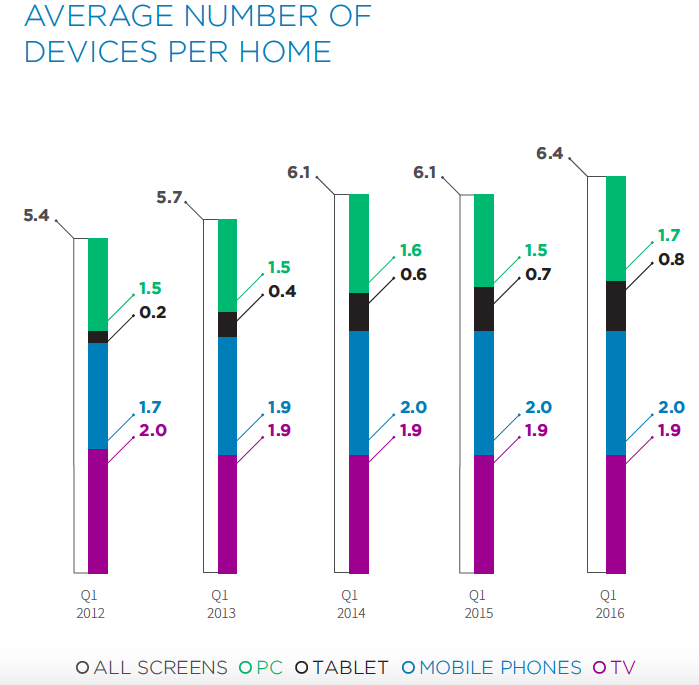
Australian households have more screens, the majority of which are internet-capable.
• There are an average of 6.4 screens per home, up from 5.4 in Q1 2012.
• Tablets have seen the most dramatic growth, while the number of TV sets has fallen slightly from 2.0 per household to 1.9 now. [refer graphic: Average number of devices per home]
• As any connected screen can be used like a PVR, more devices create more opportunities to view.
• OzTAM’s Video Player Measurement service, which measures viewing of participating broadcasters’ internet-delivered TV content, shows approximately 2.31 million connected devices access catch up TV each week.
More content choice and ways to get it mean Australians are spreading their screen activity.
• 86.1 per cent of Australians watched broadcast TV (free-to-air and subscription channels) on in-home TV sets each week in Q1 2016 (88.1 per cent in Q1 2015).
• Broadcast reach remains strong in all major age groups.
• Content and platform options continue to grow, and the TV set can be used for many purposes in addition to watching television.
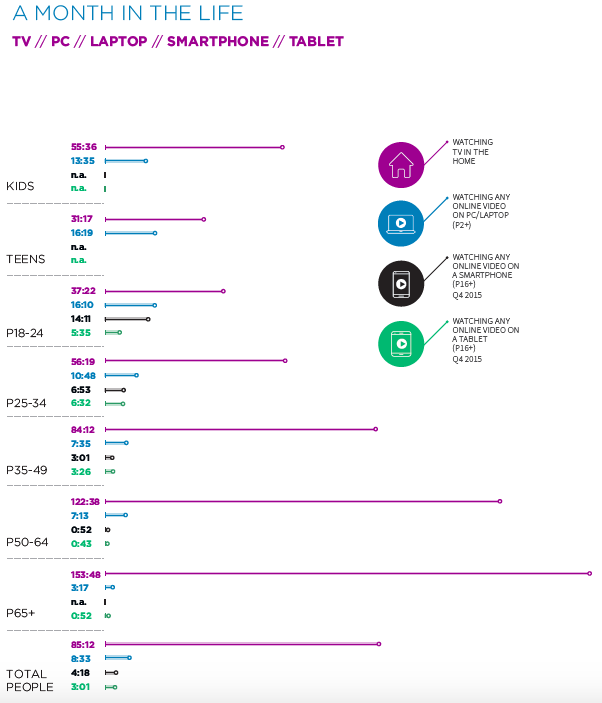
Across the day Australians spent an average of 30 hours and 38 minutes per month (30:38) on other TV screen use in the latest quarter, with 13:34 of that in prime time.
• As the number of hours in the day remains constant, the net effect of greater choice and opportunity to view is Australians spend a little less time each day watching live TV or playing it back on their TV sets within seven days than they did a year ago.
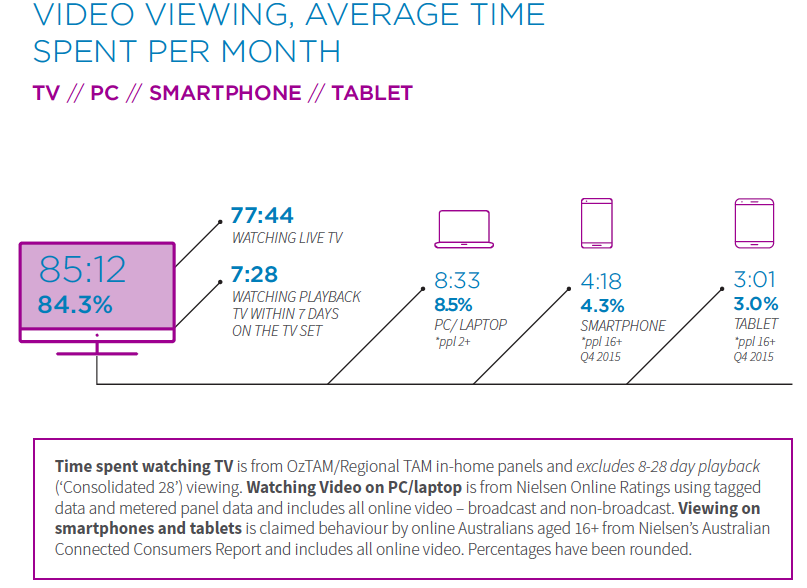
• Across all screens, devices and types of video however, 84.3 per cent of viewing is to TV content watched on in-home sets within seven days of original broadcast: on average 85:12 per month.
• Year-on-year, the share of time spent viewing any video content on computers, tablets or smartphones rose from 11.6 per cent to 15.7 per cent.
• While people, particularly those aged 24 and under, increasingly use connected devices to watch TV and other video, broadcast TV viewed on TV sets accounts for the largest proportion of viewing time on any single device.
[refer graphic: A month in the life]
• “Longer-tail” viewing is becoming significant and is one of the factors impacting the decline in time spent viewing live broadcast TV content, particularly in prime time.
• 1.6 per cent of all broadcast TV watched on in-home TV sets in any four-week period is time-shifted (played back) between eight and 28 days of the original broadcast. In prime time the proportion of 8-28 day playback rises to 2.1 per cent.
• VPM material accounts for around 1 per cent of all broadcast content viewed each month.
• Together, 8-28 day time-shifted viewing on in-home TV sets and VPM viewing on connected devices now account for 2.5 to 3 per cent of monthly broadcast content watched.
• This ‘longer tail’ viewing is on top of broadcast TV watched live or played back within seven days. 8-28 day viewing and VPM viewing do not feature in the time spent viewing figures throughout much of the Multi-Screen Report.
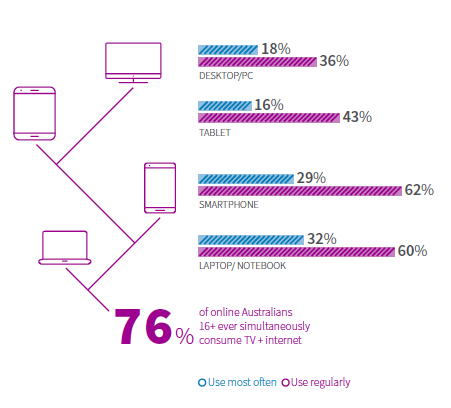
Online Australians maintain a high level of multi-screening.
• Simultaneous screen use is stabilising among younger consumers but continues to rise among certain older segments.
• 76 per cent of online Australians claim to multi-screen (watch TV and use the internet simultaneously).
• 33 per cent now say they access content on two or more devices while watching TV (i.e., triple-screening).
• Nine in 10 online consumers aged 16-34 say they multi-screen, little changed on the previous year, with people 65+’s multi-screening also largely stable.
• The 35–49 and 50–64 year-old segments both increased their multi-screen behaviour, with the bulk of growth in triple-screening.
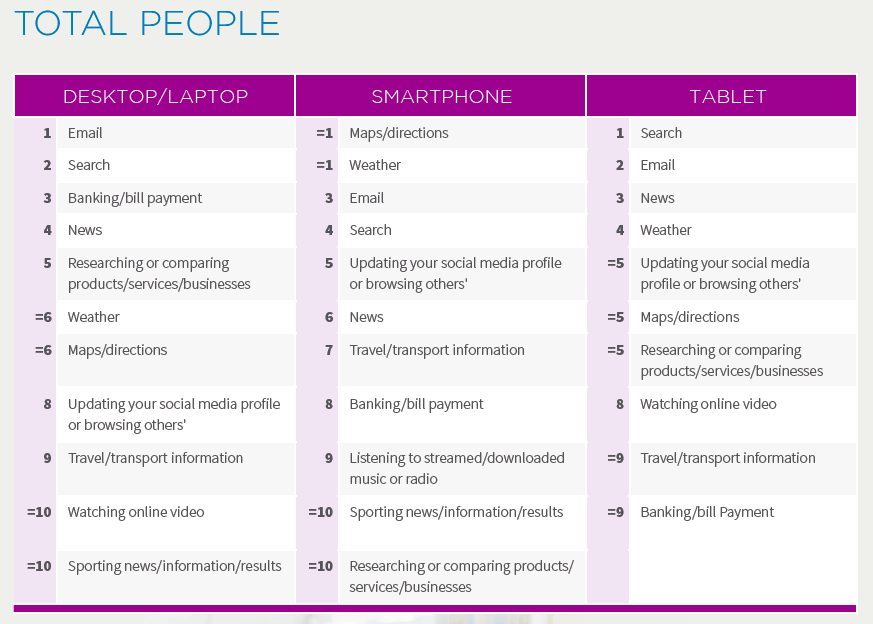
Popular activities on connected devices vary.
• The most common activities on desktop and laptop computers are email, search and banking.
• Key activities on tablets are similar to computers, with search, email and news the most common.
• The top smartphone activities are related to getting information outside the home, such as accessing maps and directions, checking the weather, and other small or frequent tasks.
• Checking social media is more prominent on both smartphones and tablets than computers.
• Watching online video is more popular on computers and tablets due to larger screen sizes (people’s tenth most common activity on computers, eighth on tablets).
• Among specific age groups 18+, 18-24s are most likely to watch online video on a computer (their third most common activity on that device), tablet (second most common) or smartphone (tenth).
• For 25-34s, watching online video on a tablet is third, on a computer sixth, and smartphone tenth.
• Among 35-49s watching online video is fourth on a tablet, tenth on a computer and outside the top ten on smartphones.
• People aged 50+ say watching online video is outside their top ten most popular activities on all three devices.
OzTAM CEO Doug Peiffer said: “Many more screens, vastly greater content and platform choice, yet the same number of hours in the day: if anything’s surprising it’s how strong broadcast TV remains. Since 2012 the Australian Multi-Screen Report has tracked the impact of new technologies on viewing of TV and other video content. The interesting thing in the latest quarter is that 8-28 day playback viewing on TV sets, and VPM content played on connected devices, together add approximately 2.5 to 3 per cent of viewing on top of 7-day Consolidated broadcast viewing. While relatively small overall, for certain individual program episodes this longer-tail and VPM viewing can be significant.”
Deborah Wright, Chair of Regional TAM and Nine Entertainment Co Director of Regional Strategy, said: “With the greater choices available to consumers in both content and platforms, it is encouraging to see broadcast television continuing to deliver strong reach results to Australians via their in-home TV sets. In fact, our regional audiences spend almost 95 hours on average during a month watching broadcast television, which is 9.5 hours more per month than the national average.”
In summary:
• 22.323 million Australians watch broadcast television (free-to-air and subscription channels) each month, with average weekly reach at 86.1% of the population[1].
• Australians watch on average 85 hours and 12 minutes (85:12) of broadcast TV on in-home television sets per month (live + played back through the TV set within seven days). Year-on-year this is down 4:16 per month.
• 91.2% of all broadcast TV viewed within seven days is live (77:44). Playback of broadcast content through the TV set within seven days comprises 8.8% (7:28 per month; 7:31 in Q1 2015).
• Approximately 99% of all broadcast TV material viewed each month takes place on in-home TV sets
• 100% of Australian television homes can access digital terrestrial television (DTT) channels.
97% can do so on every household TV set and 95% can receive high definition (HD) DTT broadcasts on all TV sets in the home.
• As people will often upgrade a tablet or mobile phone and retain the older one for secondary use, the number of screens in homes continues to grow even as penetration levels for various device types plateau:
• 58% of homes have PVRs; 17% have two or more (Q1 2015: 56%; 15%).
• 35% of homes have internet-capable TVs, whether connected or not (Q1 2015: 30%).
• 49% of homes have tablets (47% in Q1 2015).
• 81% of Australians aged 14+ own a smartphone (76% in Q1 2015)[3].
• Household internet penetration is stable at 81%.
• Australians spend on average 50:30 per month online.
• 13.03 million Australians watch some video on the internet each month (including broadcast TV and non-broadcast content): on average 8:33 per month, up from 6:57/month a year ago. Such viewing is highest among teens (16:19 per month)[5].
• 84.3% of all video viewing – across all screens, and including broadcast TV content viewed up to seven days after the original broadcast as well as non-broadcast content – takes place on in-home TV sets:
– 85:12 per month on in-home TV sets (live + 7-day playback) (84.3%)
– 8:33 per month online via PCs/laptops (8.5%)
– 4:18 per month on smartphones (4.3%)
– 3:01 per month on tablets (3%)