The latest Australian Multi-Screen Report, covering the fourth quarter of calendar 2014, considers household takeup of screen technologies and the interplay between them.
Viewing of video content on internet-connected mobile devices has grown year-on-year though it remains small relative to the time Australians spend watching broadcast television on in-home TV sets.
Technology in Australian homes
Household takeup of internet-capable devices reached a new high in Q4 2014.
Internet-capable TVs have the fastest adoption rate: 30 per cent of homes now have a smart or hybrid TV – whether actually connected to the internet or not (23 per cent a year ago).
• All Australian television homes can access digital terrestrial broadcast (DTT) channels on at least one household TV set, with 95 per cent of TV homes able to access DTT channels on every working household set.
• 56 per cent of homes have a personal video recorder (PVR) compared to 53 per cent in Q4 2013; 15 per cent own two or more.
• Takeup of tablets continues to grow although not as quickly as in previous quarters. An estimated 47 per cent of homes now have at least one tablet (40 per cent a year earlier, and 45 per cent in Q3 2014).
• 73 per cent of Australians aged 16 and over own a smartphone (68 per cent in Q4 2013).
• 80 per cent of homes have an internet connection, unchanged over the past seven quarters.

Viewing on various screens: A year in review
During the 2014 calendar year Australians viewed an average of 3 hours and 6 minutes (3:06) of broadcast television per day, similar to levels in previous years.
This includes free-to-air and subscription channels, both live (that is, viewed at the time the broadcast actually went to air) and playback (viewing of recorded content at normal speed through the TV set within seven days of the original broadcast using a device such as a PVR or DVR).
Age groups watching more television in 2014 compared to the previous year include children 12 and under, and adults aged 50-plus. Across the overall population, viewing declined in 2014 vs 2013 by an average of 31 seconds per day.
The vast majority of all TV viewing is live, with less than 10 per cent viewed in playback mode. Reflecting the takeup of PVRs, all age groups have increased their playback viewing in each of the past four calendar years, with 13-17s’ playback steady in the latest year-on-year period.
Looking at Q4 2014 specifically:
• Australians watched an average 90 hours and 27 minutes (90:27) of broadcast TV (free-to-air and subscription channels) each month in the quarter.
• That compares to 92:39 in Q4 2013 (down 2:12 per month, or 86 seconds per day, year-on-year).
• Seasonality has long been a factor in television viewing levels: people watch more television in winter and less in summer and with the start of daylight saving time.
• 91.9 per cent of TV viewing in the quarter was live (83:06) and 8.1 per cent (7:21) was watched in playback. Compared to Q4 2013 playback increased by 34 minutes, with all major age groups aside from 18-24s watching more TV in playback mode.
• Television remains the primary household screen. Across all devices, and including broadcast and non-broadcast content, 88 per cent of all video viewing took place on TV sets in Q4 2014:

Australians aged 2 and over spent 7 hours and 28 minutes (7:28) per month in the quarter viewing online video on a PC or laptop (e.g., streamed video such as internet-delivered catchup TV as well as other content such as YouTube), up from 5:52 a year earlier.
Across the Australian online population aged 16 and above people claim to spend 2:03 watching any online video on a tablet each month, up from 1:47 per month in Q4 2013.
Australians aged 16+ reported spending 2:47 watching any online video on a smartphone in the quarter, compared to 1:56 a year earlier.
As seen in earlier editions of the Multi-Screen Report, younger audiences watch more video on connected mobile devices than older age groups do, though people of all ages spend the majority of their viewing time watching broadcast TV on in-home TV sets.

Total use of the television screen
Over the past four years Australians have been spending more time with their television sets overall because the TV set can now be used for a variety of activities in addition to watching broadcast television – whether on its own or in conjunction with devices attached to it.
In calendar 2014, Australians’ total use of the TV set – including live and playback TV viewing, and other screen use – averaged out at 16.4 per cent TARP across the whole day, up modestly on the year before.

Broadcast TV viewing was stable year-on-year.
As a percentage of total broadcast viewing, live viewing (i.e., TV content watched when the broadcast actually went to air) declined slightly.
Playback of recorded broadcast material through the TV set within seven days using a PVR or DVR rose slightly, as it has in each of the past four years.
Other screen use – that is, when people use their TV screens for purposes other than watching live or playing back broadcast television – has risen incrementally each year.
Examples of such activity include gaming; viewing OTT services; accessing network catchup TV (streaming) services; internet browsing; watching DVDs; or playing back recorded TV content beyond seven days from original broadcast.
OzTAM CEO Doug Peiffer said: “The Multi-Screen Report shows how life stage impacts media use across devices. Teens have always been the lightest TV viewers, and as people get older and have children they stay home more and watch more TV. Now however Australians of all ages are viewing more on second screens, and their overall use of the TV screen is growing too. But people still turn to the main household TV first and will continue to do so. The death of TV will follow the death of the couch.”
Regional TAM Chair and NBN Television CEO Deborah Wright commented: “This issue of the Multi-Screen Report highlights the continuing dominance of television as the primary screen in the household, and regional viewers are in fact consuming more TV on average per month when compared to 2013. This again showcases the strength of broadcast television and, in particular, regional television.”
Nielsen’s Senior Vice President, Cross Platform Audience Measurement, Erica Boyd said: “Australians have a large appetite for good content and TV sets continue to be the main place audiences go to satisfy this need, supplemented by content viewed on digital technologies. The latest Multi-Screen Report shows TV viewing hours remain relatively stable compared with previous years, with traditional seasonality spikes and life stages continuing to influence consumers’ watching habits. While we’re seeing the increase in mobile devices resulting in increased viewing time on smaller screens, the majority of TV viewing still takes place on traditional sets.”
Summary of key findings: Q4 (October – December) 2014:
• Australians watch on average 90 hours and 27 minutes (90:27) of broadcast TV on traditional television sets per month (year-on-year down 2:12 per month, or 86 seconds per day).
• 91.9% of all broadcast TV viewing is live (83:06) with playback of broadcast content that viewers record and play back through their TV sets within seven days accounting for 8.1% (7:21 per month, up 34 minutes/month YOY).
• 100% of Australian television homes can access digital terrestrial television (DTT) channels. 95% can do so on every working household TV set.
• 56% of homes have PVRs; 15% have two or more (Q4 2013: 53%; 14%).
• Household internet penetration is stable at 80%.
• Australians spend on average 37:08 per month online (37:39 a year ago).
• 30% of homes have internet-capable TVs, whether connected or not (Q4 2013: 23%).
• 47% of homes have tablets (40% in Q4 2013).
• Across the online population aged 16+, people claim to spend an average 2:03 per month using tablets to watch any online video – which can include both broadcast television and non-broadcast material (1:47 in Q4 2013).
• 73% of Australians aged 16+ own a smartphone (68% in Q4 2013) and self-report an average 2:47 per month[4] viewing any video on these devices (1:56 a year ago).
• 13.288 million Australians watch some video on the internet each month (including broadcast TV and non-broadcast content): an average of 7:28 per month (5:52 a year ago). Such viewing is highest among people aged 18-24 (10:56/per month).
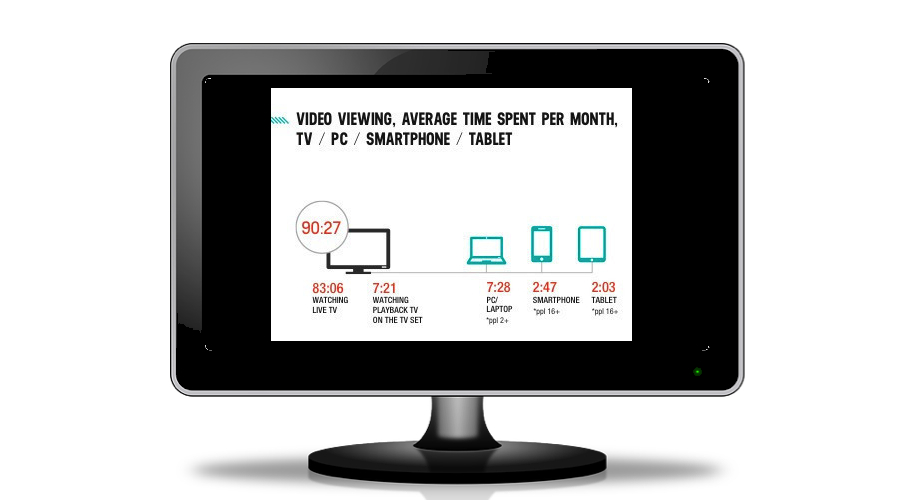
• 88% of all video viewing – across all screens, and including broadcast and non-broadcast content – is on the traditional TV set:
90:27 per month on the TV set (88%)
7:28 per month online via PCs/laptops (7.3%)
2:47 per month on smartphones (2.7%)
2:03 per month on tablets (2%)
Sources: Regional TAM, OzTAM, Nielsen