
Australia’s media agency market has emerged from the federal election period finely balanced, reports SMI in its latest review of ad spend.
In a release accompanying its May 2022 data, SMI said the total spend was just below the record level reported in May 2021 but above the total invested in the previous election month of May 2019.
Overall, total ad spend for May is stable on last year’s very high benchmark, back just 0.9%, with the key feature for May being an extra $41m in political party/industry association (excluding UAP spend) and government category continued to grow, this time up 42% YOY.
SMI AU/NZ managing director Jane Ractliffe said federal elections usually create an abnormal spike in monthly spend data, but this election period was unusual as the market was being compared against the May 2021 result which was the largest ever spending May on record.
“The better measure is total ad spend in the last federal election period of May 2019, and the level of ad spend is 0.2% above that total,” she said.
“It also looks as though some advertisers have decided to move campaigns into a more uncluttered media environment in June as we can see in the SMI forwards data that 83% of the value of advertising booked in the record June 2021 period has already been confirmed (ex Digital).”
Above: Two messages used in advertising during the May 2022 election campaign
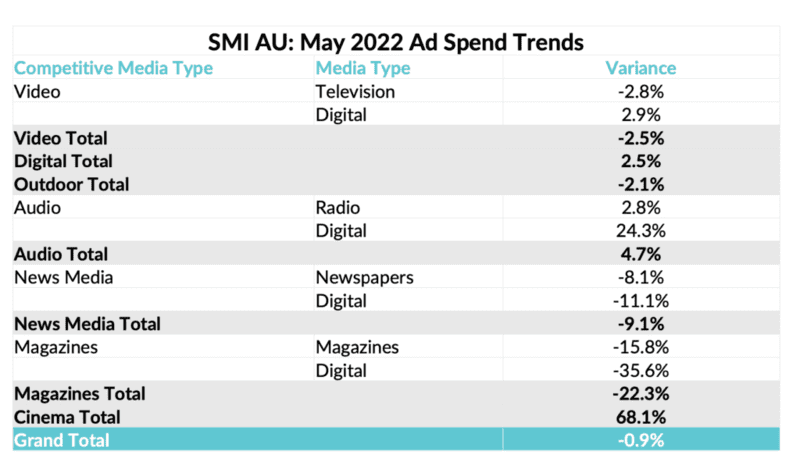
For May SMI is reporting more patchy ad demand with digital bookings up just 2.1% although key sectors such as search, social media and video sites delivered higher growth rates.
Similarly, video ad spend (ex UAP) was back 2.5% but within that linear regional TV bookings grew 7.2%. Audio (+4.7%) and cinema (+68%) media delivered growth on a standalone basis.
Within the key political party/industry association category the majority of ad spend continues to go to TV/video with its share of the category increasing to 72% in May from 68.5% in May 2019. The biggest change since the last election was this category’s move of significant investment from digital media to outdoor.
Outside of election-related categories, there was a softer market with retail category bookings back 5.7%, food/ produce/dairy ad spend back 17.5% and auto brand ad spend remaining weak, back 26% YOY. As a result, if the government and political party categories are removed the underlying market was back 9.1% YOY.
After months of continued growth, the longer-term outlook remains very positive with SMI reporting record levels of ad investment in both the CYTD (+7.8% on the prior-year period) and FYTD as the market has grown more than 12% in that time to be through the $7 billion mark for the first time over these 11 months.
This month SMI has overhauled the reporting of the financial services market with its ad spend now organised on a product basis. This means SMI categories such as banking and the new wealth management category now include ad spend from any provider of financial services, including the new fintech companies.
Ractliffe continued: “SMI has responded to feedback from the banking sector that we needed to provide a broader view of this market to better reflect emerging players and this change has also resulted in the creation of a new wealth management product category and three new subcategories: superannuation, wealth management and payment platforms.
“As the accurate SMI data is a crucial tool in share of voice analysis – especially for digital media where category ad spend can be viewed for search, social media and programmatic and by digital publisher – we are always keen for feedback on how to better reflect changing category ad spend trends.”
See also:
US private equity invests in Standard Media Index and appoints new CEO