Australian online advertising has recorded another solid quarter, reaching $1,731m for the quarter ending March 2016, a 33.5% year on year increase. The data, which comes from the latest IAB/PwC Online Advertising Expenditure Report, also shows that mobile advertising is now fast approaching 50% of the General Display advertising, while video advertising accounts for over 25% of General Display advertising.
According to PwC, the Australian digital advertising market grew faster than both the UK and US markets from CY2014 to CY2015, recording 25% year on year growth, compared to 16% and 20% respectively. NZ recorded 31% year on year growth. The rates of growth in both video and mobile were also significantly higher in Australia than the UK and US.

The report showed that quarter on quarter, growth was subdued at 1.3%, a typical drop following the traditionally strong Christmas season in Q4 across all media channels. However year on year, General Display advertising demonstrated strong growth of 46.7% for the March quarter, driven by mobile and video growth. Search and Directories advertising recorded an increase of 29.9% year on year, while Classifieds grew 20.8% year-on-year for the March quarter.

“After a busy Christmas retail season, the first quarter of the calendar year is usually quieter in ad spend. Digital, however, still grew overall. This goes to show the central role and increasing regard in which digital is held by many marketers and agencies,” said Megan Brownlow, PwC executive director.
Mobile advertising expenditure increased to $507.8 million in the March quarter 2016, with 57% of mobile ad expenditure attributed to mobile Display and 43% to mobile Search. The total expenditure comprises general display and search, as well as mobile video advertising and is based on participants’ data, industry estimates for Google’s mobile display and search revenues, Twitter’s mobile display revenues and Facebook’s mobile display revenues.
Video display advertising contributed 25.3% of general display expenditure, broadly consistent with the same quarter in 2015. FMCG continues to lead video advertising, with motor vehicles and retail rounding out the top three industry categories for video advertising and representing 46.5% of the report video display advertising market. Indeed FMCG is overly represented in video Display advertising compared to General Display, with a 25.5% share of spend in video Display, more than three times its 7.3% of share in total General Display.
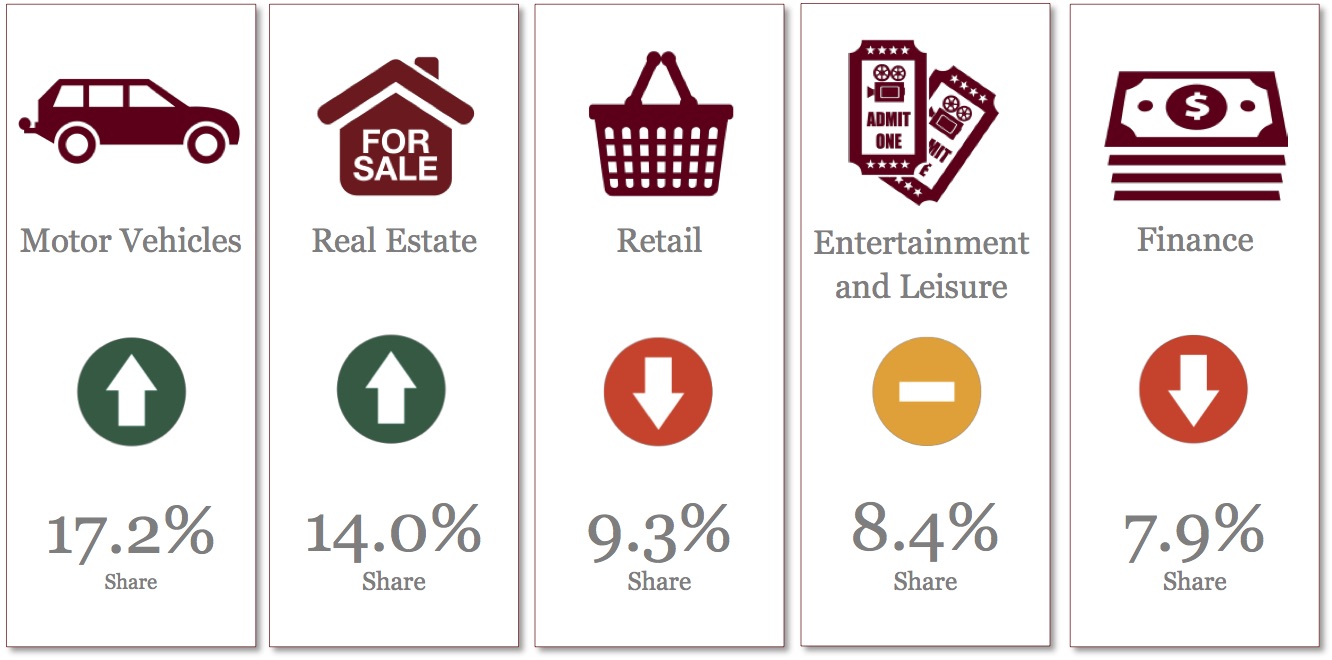
Motor Vehicles and Real Estate continued to dominate the General Display market in the March quarter 2016, increasing their share of spend from 28.5% to 31.2% of General Display
The IAB / PWC Online Advertising Expenditure Report is based on data and information reported directly to PwC by online advertisement selling companies representing over 1,000 media web sites and applications. It is the only online industry sponsored and supported measurement of online advertising expenditure in Australia. The data collected from industry participants is supplemented with estimates for Google display, video, and mobile advertising, estimates for Facebook and Twitter display and mobile advertising; and estimates for LinkedIn display and classifieds advertising.
Mobile video advertising is included in the mobile display category.